
Overview
This is one of a series of posts taking a deep-dive look at crypto assets. Each post will be updated on a weekly/fortnightly basis depending on what is happening in the market.
Some of these posts (like this one) will be free to access to give people an idea of what content is on offer but in the main these post are for subscribers.
This particular post takes an in-depth look at $VRA, covering:
what it is
monthly price action
weekly price action
daily price action
what the influencers are saying about it
What it is
$VRA’s principal offer is VeraViews, which it promotes as an end to end ad-stack solution that combines the transparency and accountability of blockchain with the security of Verasity’s patented Proof of View technology. Basically, they leverage the power of blockchain to counter adfraud and if they can get a large share of that market then they stand to make significant revenues (which the propose to use to buy back tokens, driving the price up). As always, I don’t care too much about a crypto’s fundamentals as long as they appear to have a legit use case and are viable. The jury is currently out on $VRA for a number of reasons - principally because of a lack of clarity/transparency about its circulating supply (tokens to be used by advertisers are mixed in with tokens for trade, generating concern about what its actual supply is), and because of a lack of clarity/transparency about how widely used its fraud technology is being used. But this is crypto right and generally speaking $VRA
Monthly price action

The chart above shows $VRA on the high level monthly timeframe. It went through a classic bull market pump and bear market dump cycle, retracing essentially all of the way back to its March 2021 breakout price of $0.002.
It has been in a sideways channel since mid-2022 and has yet to break out of it (by comparison $link has broken free of its channel).
This means there are huge potential upside gains to be made if (and it's a big if) $VRA starts to run hot again. 650% to get back to spring 2021 pivot resistance and a whopping 1500% to get back to all time highs.
Weekly price action


The two charts above show $VRA on the weekly timeframe, effectively showing the sideways channel the token has been in since mid 2022. The first charts provides a TA perspective and the second uses my custom indicator.
In TA terms, $VRA has two relatively clean price trendlines which it needs to break to continue upwards. The first is the developing diagonal trendline which was tapped twice at the end of 2023. The second is the horizontal resistance at $0.01 which has been tapped three times. Break this and successfully retest, and it should be blue skies ahead. It is a similar story to the downside with diagonal and horizontal price support at $0.0035-$0.0045 a key level to hold.
RSI tells a similar story with a break up through the diagonal trendline likely to coincide with a similar price action break.
The rolling pattern of red dots, green dot, red dots and so on shown in the custom indicator chart reflects the inability of price to break up above the $0.01 level.
Daily price action


Zoomed in on the daily we can see that $VRA has rolled over since a local high of $0.009 in November and has been consolidating at around the $0.005-$0.006 level since the turn of the year. Price action has been disappointing given that RSI broke through its trendline, but failing to break above the 50 level into bullish territory. It seems likely that $VRA could spend some more time around the $0.005 level before breaking up through its diagonal price trendline.
The custom indicator view tells a similar story with price failing to get back above the macro trendline since it broke down in December and no green dots yet printed in 2024.
In short, I'd be waiting for the price trendline to break on the daily before looking for a $VRA entry, although there is a strong argument that anything belowthe $0.005 level should offer good DCA potential.
What the influencers say
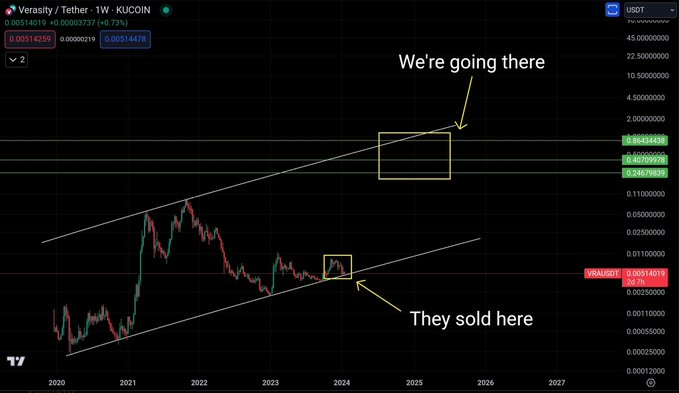
@verasityjuggler on twitter provides a channel perspective on where $VRA may return to:
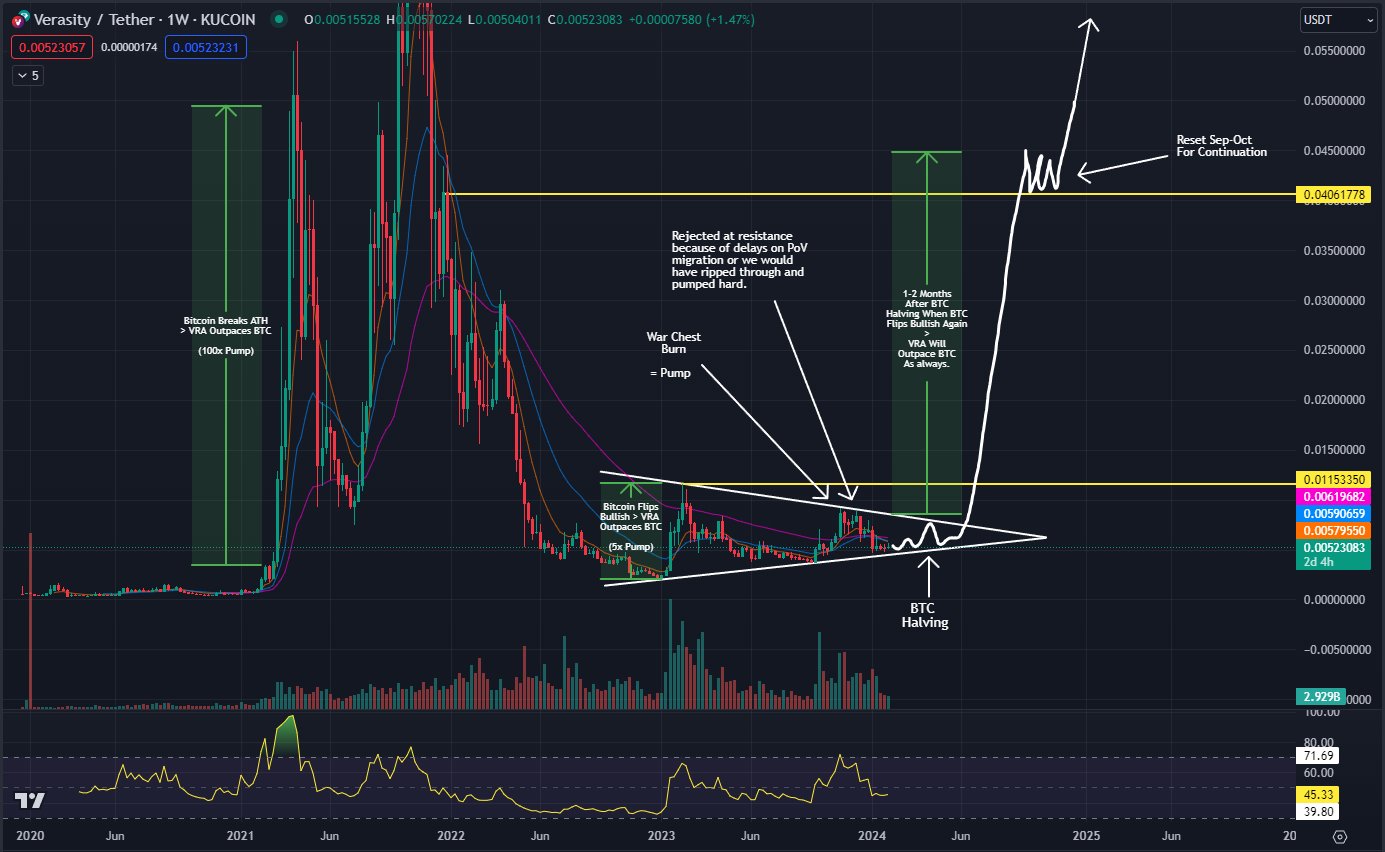
@donnydicey on twitter sets out some similar scenarios to what's set it my monthly timeframe above.
@cryptomagnified on twitter identifies the same key local flip level as I do.

Conclusion
I hope you enjoyed this look at $vra. I'll be doing similar deep dives for other coins shortly.
&author=Crypto%20explainer&url=%40cryptoexplainer&avatarUrl=https%3A%2F%2Fstorage.googleapis.com%2Fpapyrus_images%2F66e1dd8d6f9960d9150bdcb1e2976019.jpg&featuredImageUrl=https%3A%2F%2Fstorage.googleapis.com%2Fpapyrus_images%2F7114effdad17dcb3be4278231b3f66ce.jpg&size=512)
