
This is the seventh in a series of free newsletters I intend to publish, at least on a weekly basis but potentially more often depending on developments in the market. This one, which I hope to publish around each Sunday weekly close, will focus on updates to the weekly charts using TA and my custom indicator. If your favourite coin isn't included feel free to ask me to cover it.
Last week saw a long-awaited correction, with $btc pulling back to the low and mid-60s range and a wide range of als correcting 20-30% or more. This correction is not unexpected and has plenty of historic precedent. The question is whether that is it and price will now begin to expand further upwards or a bigger correction to around $50k is on the cards. My money is on the former but only time will tell.
Weekly chart updates
Bitcoin $btc
Last week's TA & custom indicator


This week's TA & custom indicator
Btc pushed through its previous ATH with relative ease but has since stalled. The question is whether it is now consolidating below the previous ATH before pushing through or is going to correct further. The parallel channel below suggests a range high of $90k in due course, although there are plenty of analysts predicting $btc will push much higher.


$eth
Last week's TA & custom indicator


This week's TA & custom indicator
Previously we noted that $eth had convincingly broken above the key price point of $2500, then the $3000 target level and that the next obvious resistance was the $4000 level. That $4000 level was hit but price rejected heavily from it. Current support needs to hold for another run at the $4000 level, which needs to be turned into support for further upside.


inj
Last week's TA & custom indicator


This week's TA & custom indicator
We noted previously that $inj had a decisive break from its all time high and was ranging between $30-$40. $inj had pushed back up to the $40 level and if that was turned into support we should see further expansion upwards. $inj looked to be in the process of demonstrating that support level at $40 but with $btc's correction has fallen back into its range.


$htr
Last week's TA & custom indicator


This week's TA & custom indicator
Previously we noted that $htr had been range bound since the middle of 2022 and, unlike $link for example, had not yet made a convincing attempt at a break out. Since then price has convincingly broken above the last bear market resistance and is now targetting resistance at $0.18 and is currently ranging between that level and previous resistance which has turned into support.


$vra
Last week's TA & custom indicator

This week's TA & custom indicator
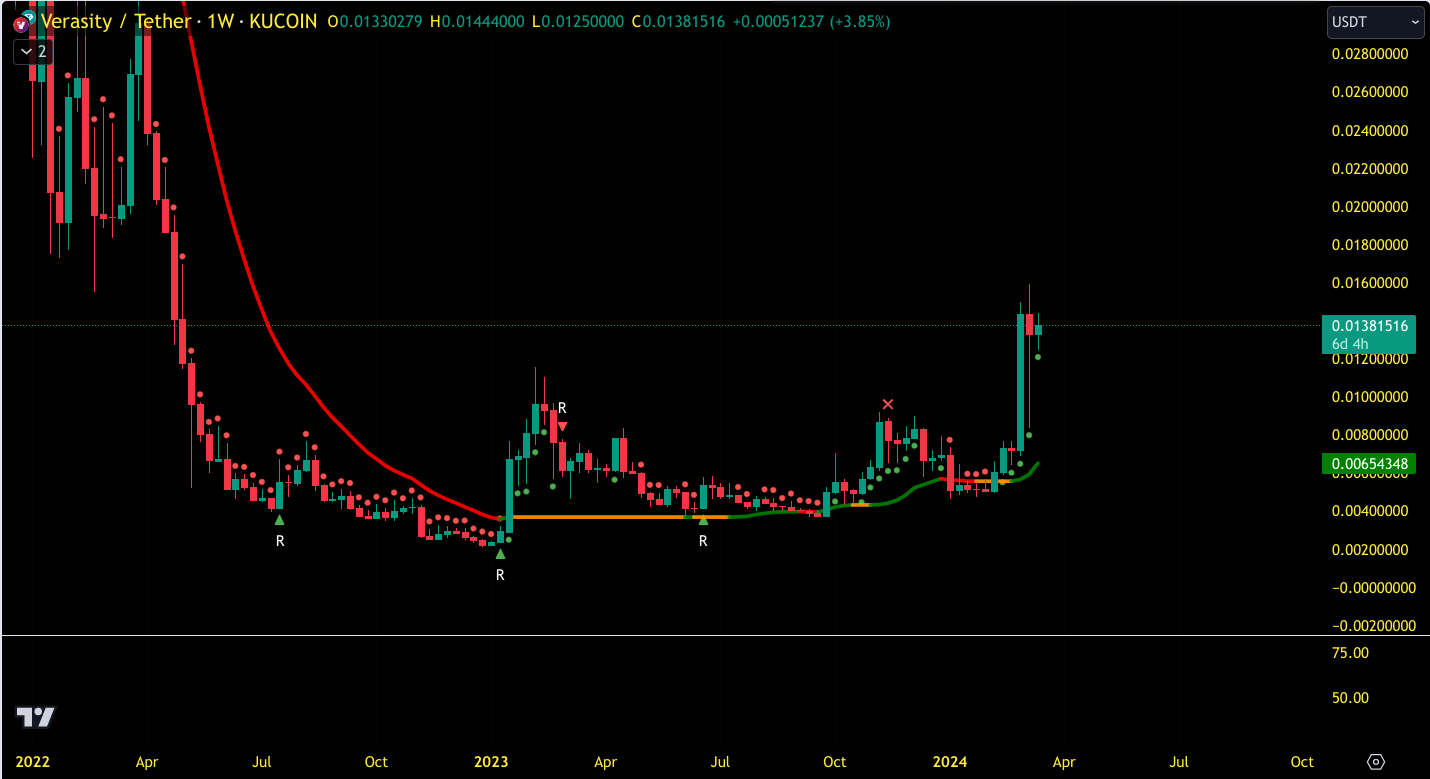
Previously we noted that $vra had been coiling under a price trendline since the start of 2023 and a similar RSI trendline over the past few months. Since then $vra had convincingly broken out of resistance and above the key $0.01 level and was heading towards its next key resistance level of $0.02, which provided some temporary support in early 2022 before price broken down. However since then price has pulled back with $btc's correction and is retesting the previous key resistance level of $0.09-0.01 as support.


$woo
Last week's TA & custom indicator


This week's TA & custom indicator
Previously we noted that $woo had successfully broken out of and retested its bear market range. And that for upwards expansion, closes above $0.4 were needed with the next big test comes at the $0.6 level. Price had been consolidating just below that $0.6 level but with $btc's correction has fallen back to retest the previous resistance level of $0.4 as support.


$rune
Last week's TA & custom indicator


This week's TA & custom indicator
Previously we noted that $rune was another coin which had successfully broken out of and retested (close enough to doing so) its bear market range. And that it had now broken out of diagonal price resistance and pushed past the key $8 level flip zone. Last week price rejected off the key resistance level around $11 and price is ranging between that level and its new support of $8.


$trias
Last week's TA & custom indicator


This week's TA & custom indicator
Previously we noted that $trias was yet another coin which successfully broke out from its bear market range and was currently giving off serious cup and handle vibes. It has been chopping back and forward over the past several weeks and hasn't yet tested the next key resistance level at $20.


$zen
Last week's TA & custom indicator


This week's TA & custom indicator
Previously we noted that $zen had been relatively disappointing, failing to break out of its bear market range and indeed trending in the wrong direction over the past several weeks. However, over the past several weeks it had turned the key flip level at $12 into support. Resistance at $15 is the next key level to flip into support.


$rose
Last week's TA & custom indicator


This week's TA & custom indicator
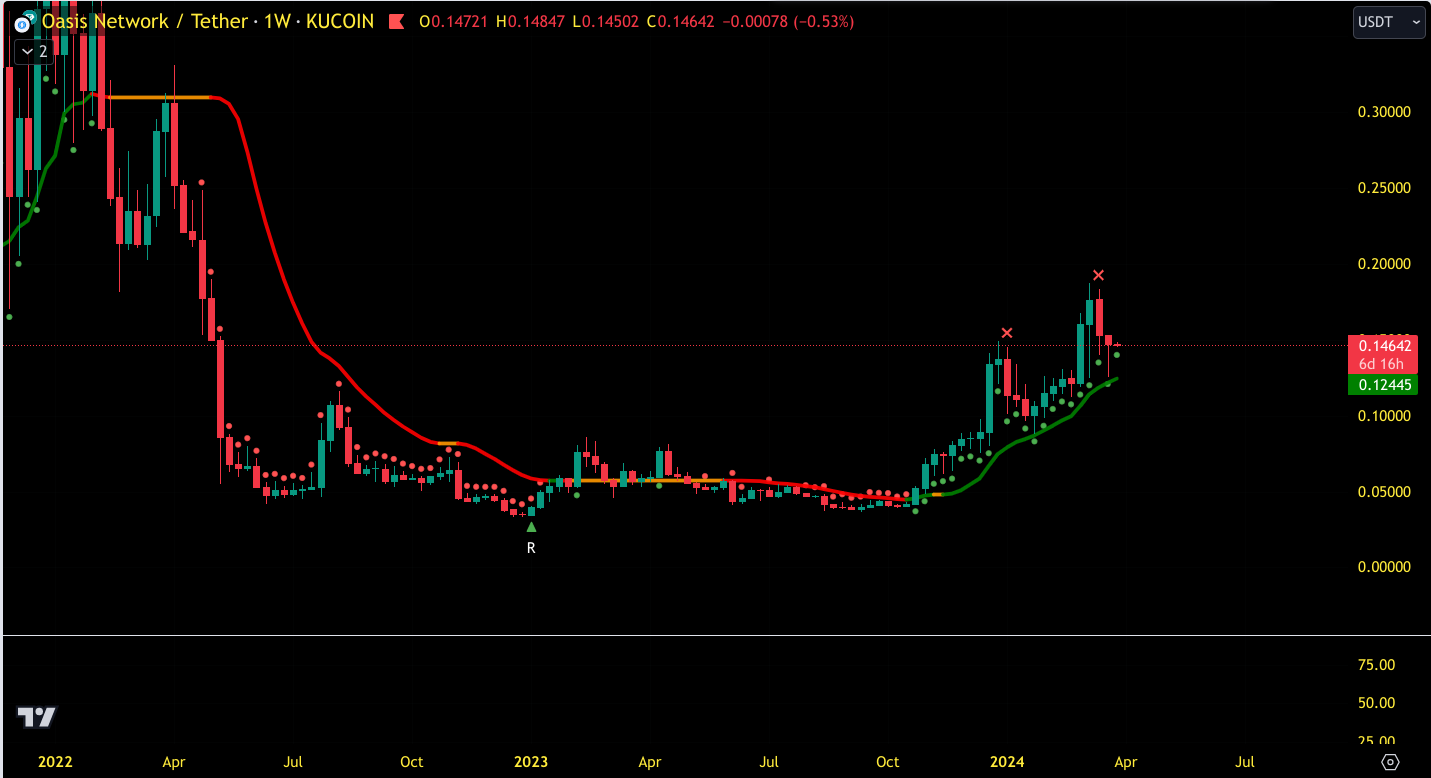
Previously we noted that $rose was another breakout and retest coin, with its momentum relatively slow since leaving its bear market range. Key resistance at the $0.16-0.17 level has been tested and price has rejected. Once that is overcome the next resistance at $0.22.

$link
Last week's TA & custom indicator


This week's TA & custom indicator
Previously we noted that $link was one of the first alts to convincingly leave behind its bear market range and had broken out from its shorter consolidation to hold above $16. The $20 level has not yet been turned into support ready for the next push up.


$avax
Last week's TA & custom indicator


This week's TA & custom indicator
Previously we noted that $avax looked like a lagging version of link, having broken out from its long-term range but not yet expanded above its current consolidation. $avax then broke that resistance and rejected off the key resistance at just over $60.


$sol
Last week's TA & custom indicator


This week's TA & custom indicator
Previously we noted that $sol had been a strong performer since breaking out of its bear market range, and looked to be consolidating before a test of key resistance. Over the last few weeks it has continued to perform strongly turning previous resistance around the $170 into support and looking ready to consolidated before a run at the $240 level.


$rndr
Last week's TA & custom indicator


This week's TA & custom indicator
Previously we noted that $rndr had pushed through resistance at the $5 range, and was making a push to the higher key resistance zone. That push continued and the question was whether price would now close above that key resistance level. Those closes now occurred and $rndr has continued to push up strongly, consolidating above the $10 level.


$dot
Last week's TA & custom indicator


This week's TA & custom indicator
Previously we noted that $dot had pushed off its key price support level and was flipping $8 resistance back into support. The skies are now relatively clear up to the next major resistance at $17.


$grt
Last week's TA & custom indicator


This week's TA & custom indicator
Previously we noted that $grt had escaped from its bear market channel and made a clean break above $0.2. We noted that key resistance ahead was at $0.03 and that might be an obvious place for its move to cool off for consolidation. That price was hit a couple of weeks ago and turned into support. Last week so a big push towards the next major resistance at the $0.5 level. Price rejected there and is consolidating ahead of a further push.


$algo
Last week's TA & custom indicator


This week's TA & custom indicator
Previously we noted that $algo had rejected hard off resistance at the $0.20 level but had found support back at $0.15 and that a grind back to the the top of channel seemed likely. Price action turned into more of a spring than a grind over the past few weeks and price hit the key flip level of $0.3 but rejected there.


$hnt
Last week's TA & custom indicator


This week's TA & custom indicator
Previously we noted last week that $hnt has been making an impressive return from the dead, although I'd still say my purchase of a helium miner last bull run was one of my worst crypto decisions ever. $hnt looked like it had broken back above a key flip zone but it has failed to turn into support for further expansion upwards and the last week couple of week saw price not only remain below that key flip zone level but back below previous resistance.


$tel
Last week's TA & custom indicator


This week's TA & custom indicator
Previously we noted last week that $tel hadn't come close to breaking out of its bear market range and was struggling to recover from a hack-related dump. However, a break of the weekly RSI trendline signalled the start of an upside recovery and $tel made short work of breaking through the key flip level of $0.0032 which had capped its upside over the past 18 months or so. It then hit and rejected off the key pivot level of $0.005 which needs to be turned into support.


$xcad
Last week's TA & custom indicator

This week's TA & custom indicator
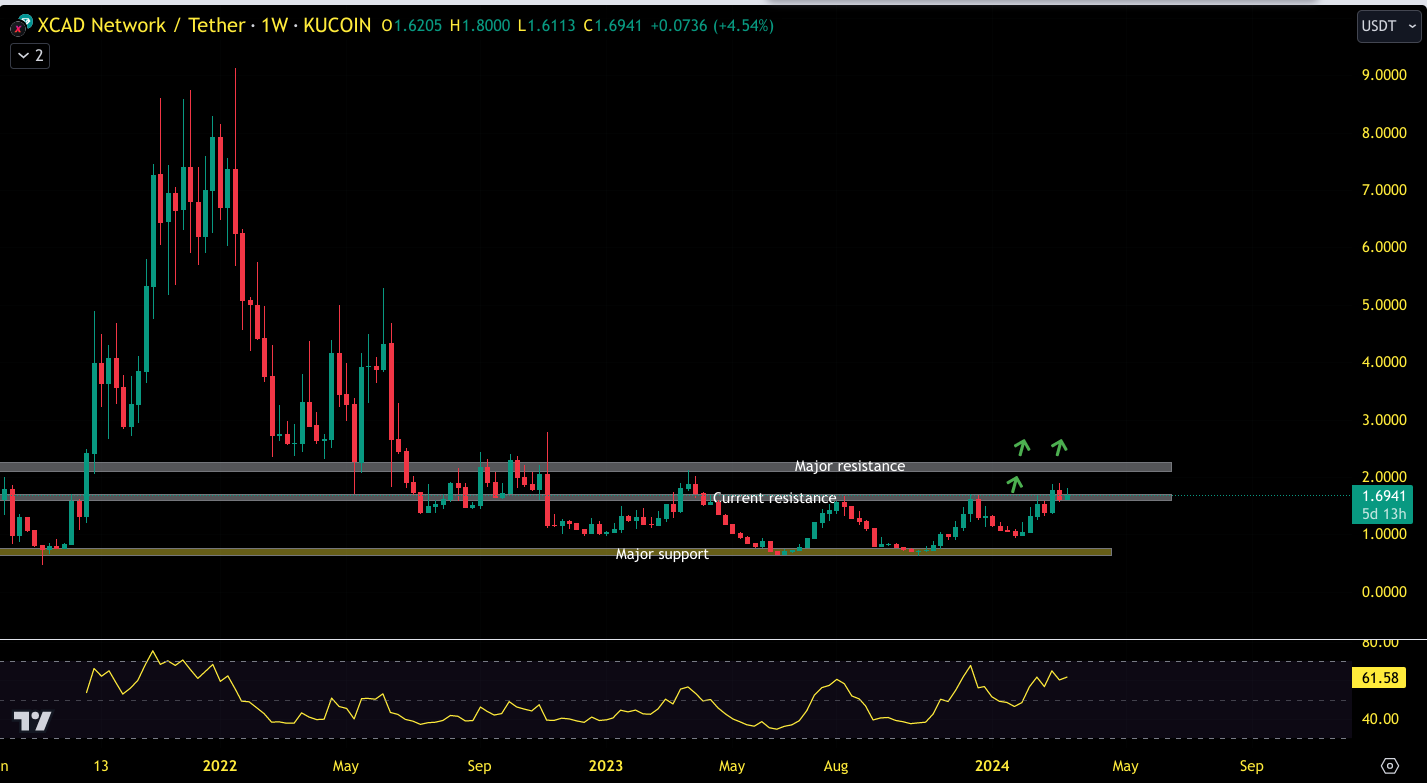
Previously we noted last week that $xcad had been extremely range bound and needed to convincingly break and hold above the $1.5 dollar level before pushing to break above $2. Price now appears to be holding above the current resistance level and is setting up for another run to the major resistance level at just over $2.


$pyr
Last week's TA & custom indicator

This week's TA & custom indicator
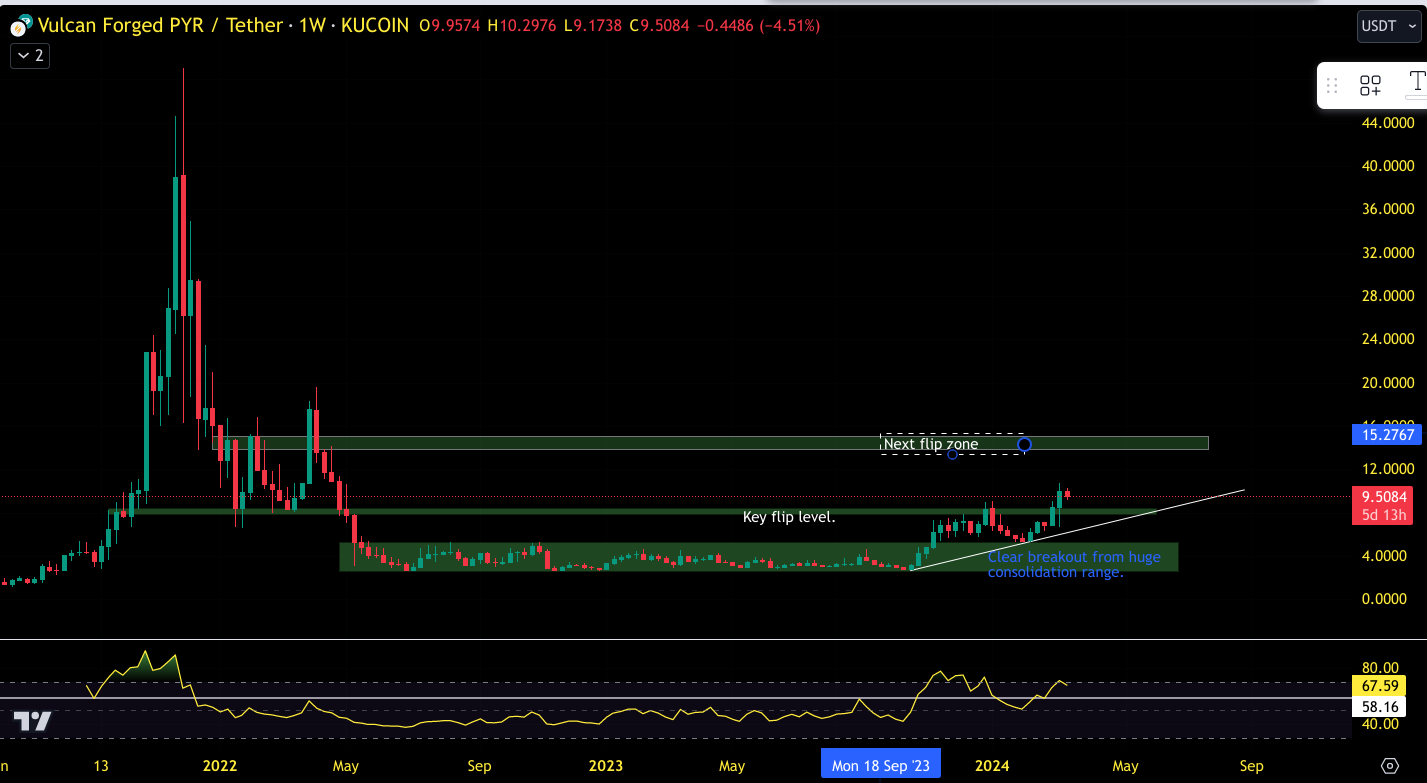
Previously we noted that $pyr price action has been super clean, breaking out from its bear market range and then rejecting hard off key resistance. Price needs to convincingly flip that level to open the way for expansion upwards.


$bax
Last week's TA & custom indicator


This week's TA & custom indicator
Previously we noted that $bax had an early run at the end of 2022 out of a cup and handle pattern and since then has given back almost all of its gains and settled back into a consolidation channel. At these price levels a small moon bag purchase still feels relatively low risk. It has gradually worked its way back towards the top of its consolidation channel, and the question is whether it is now going to consolidated before breaking free or will price drift back down to the bottom of the channel?


$doge
Last week's TA & custom indicator


This week's TA & custom indicator
We noted previously $doge was another coin which has struggled to break out from its bear market channel and price was in a bit of a no-man's land. Well, no more! Price, like many other meme coins, broke out strongly and is now consolidating below the next key flip zone


