
This is the ninth in a series of free newsletters I intend to publish, at least on a weekly basis but potentially more often depending on developments in the market. This one, which I hope to publish around each Sunday weekly close, will focus on updates to the weekly charts using TA and my custom indicator. If your favourite coin isn't included feel free to ask me to cover it.
Just like last week, Btc continues to range, making fools of those who said it was bound to go $100k or $50k immediately. It still feels like classic shakeout territory and patience is needed as btc approaches the formal halving point. Alt season isn't with us yet and alts remain choppy, with many retracing back to key support levels.
Weekly chart updates
Bitcoin $btc
Last week's TA & custom indicator


This week's TA & custom indicator
I noted last week that on the weekly timeframe it is difficult to be anything but bullish and that remains thec ase. Btc broke through its previous ATH and is now consolidating above previous weekly candle close levels. Last week I marked three support areas where btc could correct to before its next move up and all would keep the macro bullish structure intact. So far only the first has been tapped. I've added a new key flip level in green which, if btc holds, should be confirmation of the next leg up being ready to go.


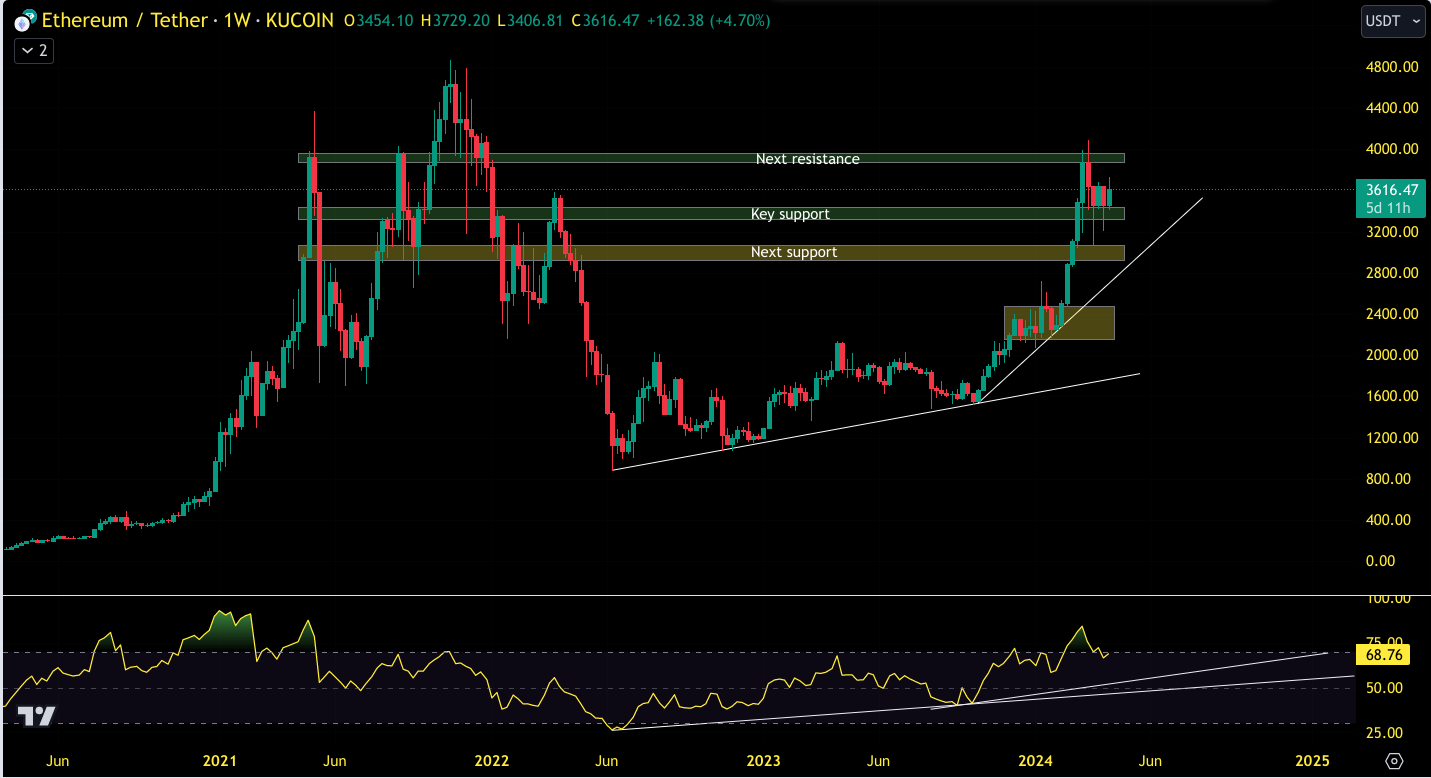
$eth
Last week's TA & custom indicator


This week's TA & custom indicator
Last week I noted that $eth was ranging between $3300 and $4000 and that current key support needs to hold for another run at the $4000 level. There hasn't been much change over the past week with $eth remaining range bound. Breaking through, and holding above, the $4000 level would be the signal for the next leg up. If current support doesn't hold then the next support at the $2800-3000 level will come into play.

inj
Last week's TA & custom indicator


This week's TA & custom indicator
Last week I also noted that $inj was very much range bound, bouncing between $30-$40. There has been a further tap of the $30 dollar level with a decent reaction to follow so there is currently good odds that that level will continue to hold before another run is made at the $40 flip zone. But break below and a tap of previous ATH support would be on the cards, although that seems unlikely in the current market environment.


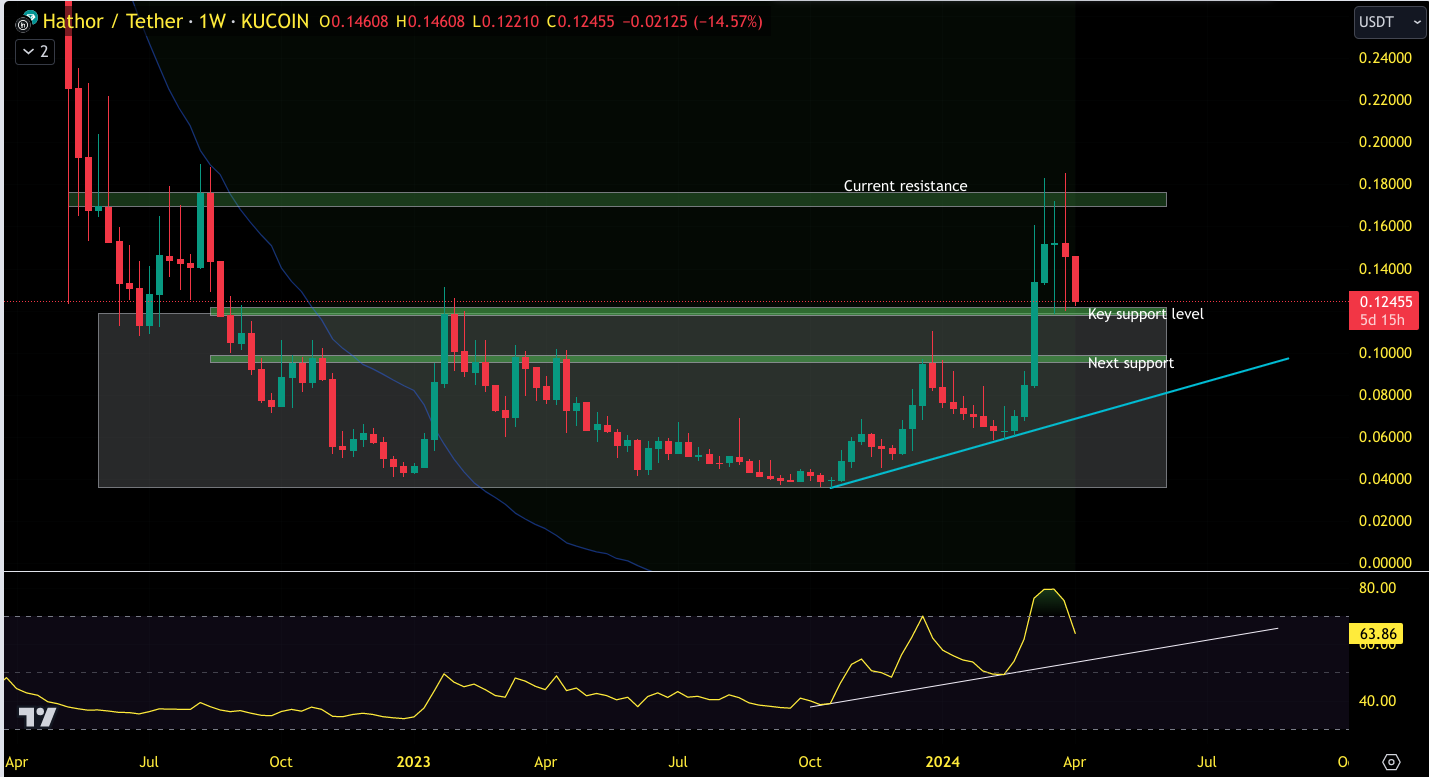
$htr
Last week's TA & custom indicator

This week's TA & custom indicator
Last week I noted that price had rejected at resistance at $0.18 and had returned to the key support level. That continues to hold as support, and ideally we would now see a string move up to turn resistance into new support, otherwise there is a chance price will be accepted back into the old bear market range.


$vra
Last week's TA & custom indicator


This week's TA & custom indicator
Last week I noted that $btc's ranging, and new $vra token drama, had caused $vra's price to dump back to the previous price trendline or failing that at key support at $0.007. Not much has changed and I would like price to consolidate here and ideally hold above that diagonal price trendline before a move back up.


$woo
Last week's TA & custom indicator


This week's TA & custom indicator
Last week I noted that having rejected from the key resistance level at $0.6 level price had returned to support at $0.4. That is where price remains, with closes below the $0.4 level likely to lead to a retest of the breakout range at $0.3.


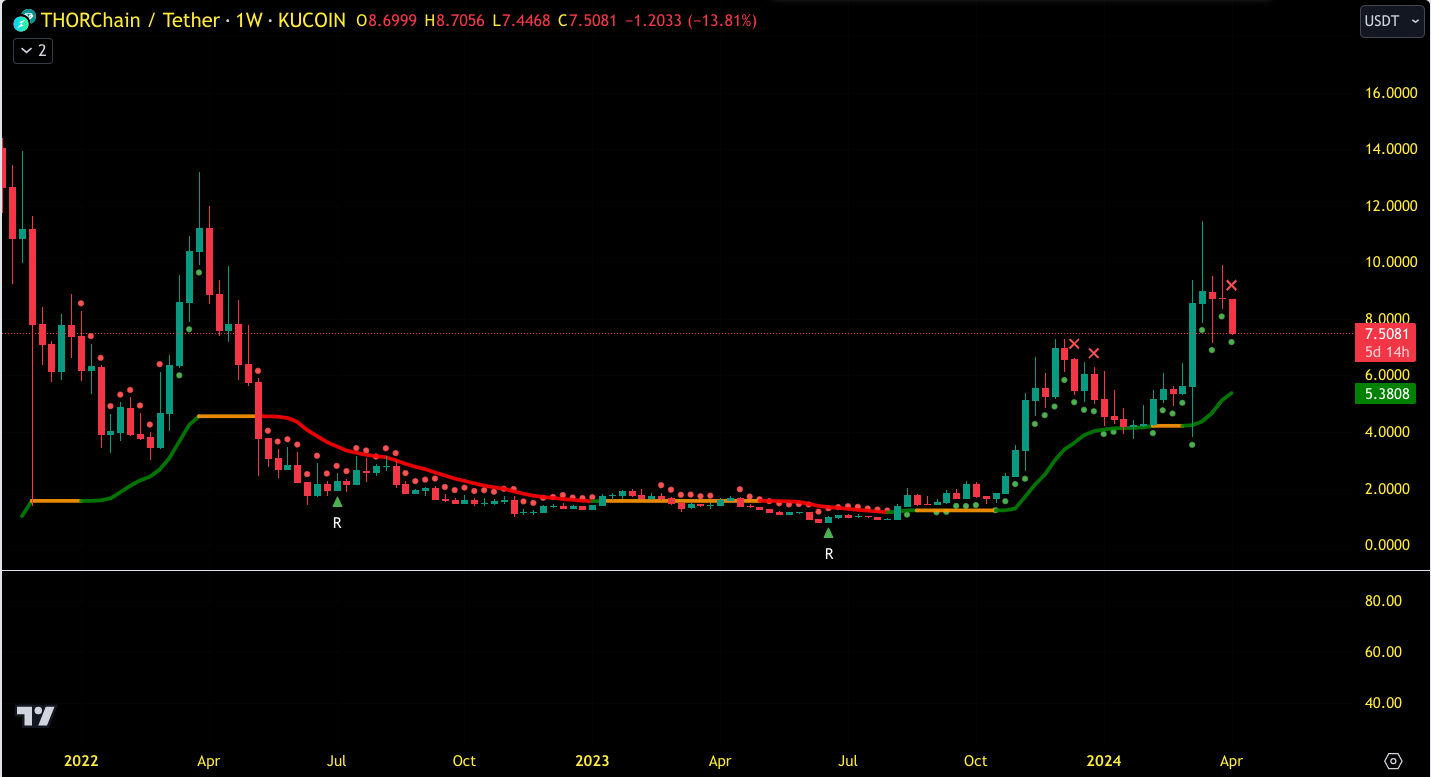
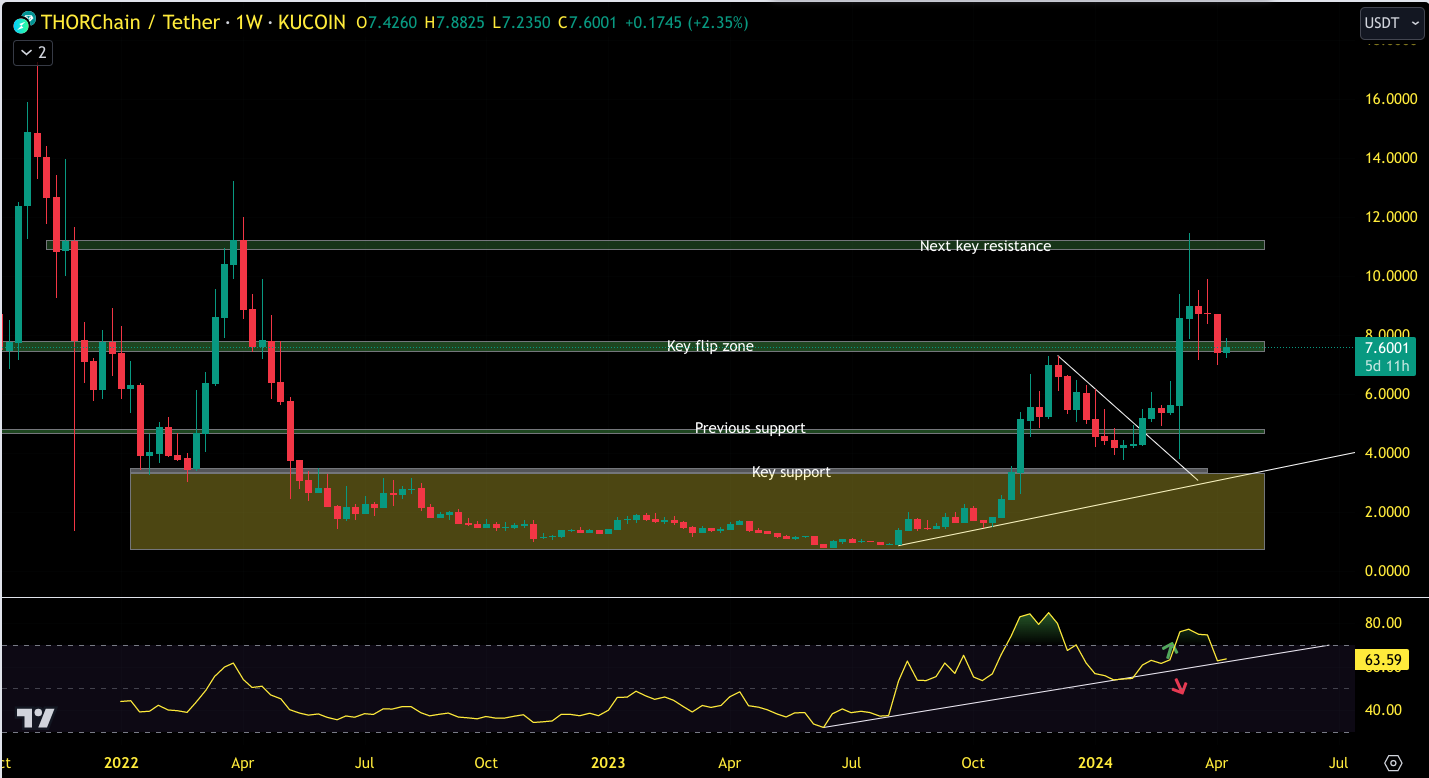
$rune
Last week's TA & custom indicator

This week's TA & custom indicator
Last week I noted that, having rejected from around $11 at key resistance, price it a new support of $8. That remains the case and with price still at risk of accepting back into the $4-8 range.

$trias
Last week's TA & custom indicator


This week's TA and custom indicator
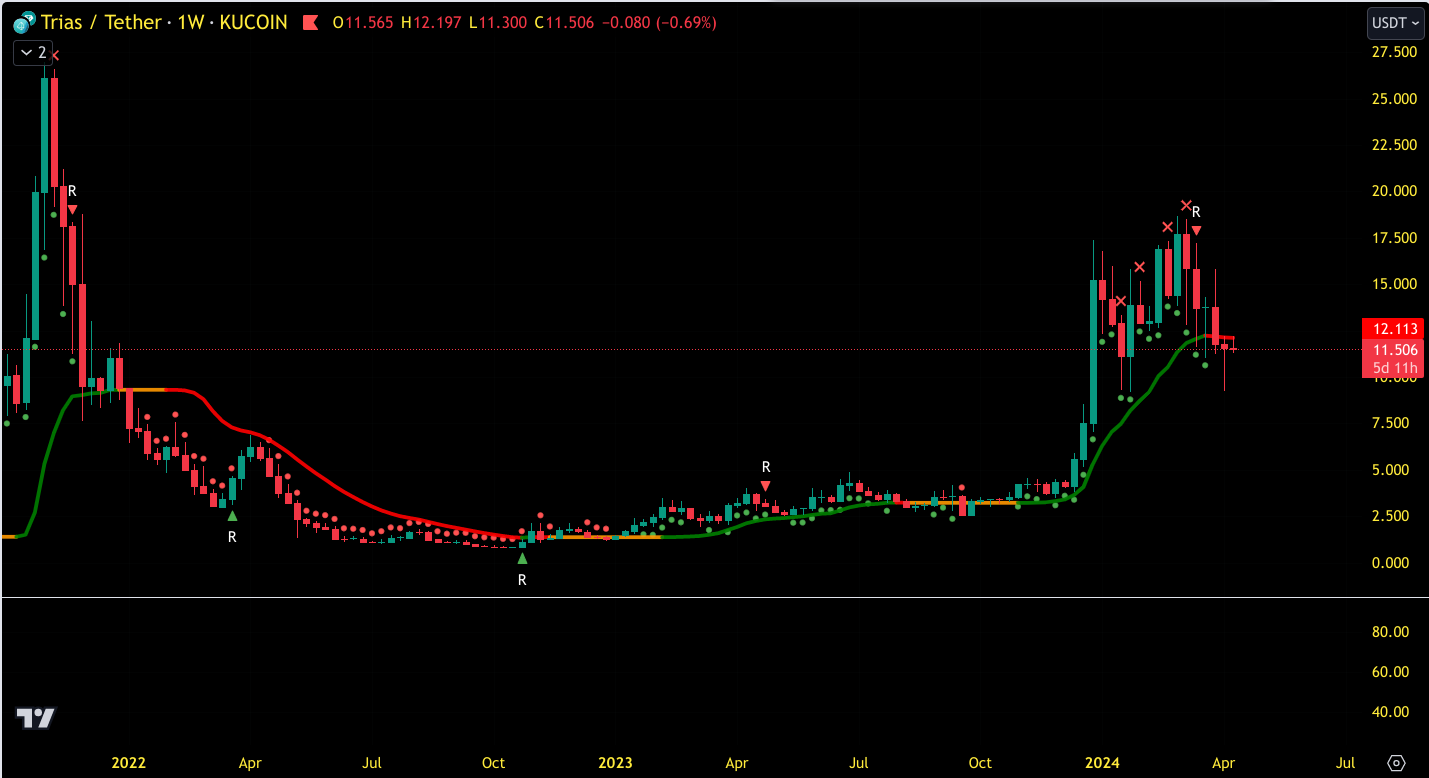
Last week I noted that although price had been mainly ranging sideways $trias was at risk of losing the key flip level around $11-12. It remains important that support at $10 holds or a return to the range high of $7 is on the cards.

$zen
Last week's TA & custom indicator


This week's TA and custom indicator
Last week I noted that having rejected from $15, we were now looking for the old flip level around $11-12 to act as support. So far it has held but it is looking possible price might accept back into the old range between $8-12.


$rose
Last week's TA & custom indicator


This week's TA & custom indicator
Last week I noted that having rejected at key resistance at the $0.16-0.17 level there was a possibility of the price trendline potentially being lost a retest of $0.1 could be on the cards. That pretty much remains the case this week.

$link
Last week's TA & custom indicator


This week's TA & custom indicator
Previously I noted that having rejceted from the $20 level, $link had been holding that level relatively well compared with other alts and looks like it is consolidating ready for a push above $20. That remains the case as long as it holds the big flip level.


$avax
Last week's TA & custom indicator


This week's TA & custom indicator
Last week I noted that having rejected off the key resistance at just over $60 it was important that previous resistance at $47 acts as support or $avax could head back down to test key support and the top of its bear market range. That remains the case.


$sol
Last week's TA & custom indicator


This week's TA & custom indicator
Last week I noted that having rejected at $200, $sol had been performing relatively strongly over the last few weeks, turning previous resistance around the $170 into support. It remains important that holds or a retest of the $140 level could be on the cards.


$rndr
Last week's TA & custom indicator


This week's TA & custom indicator
Last week I noted that, having looked like it was consolidating above the $10 level, $rndr had lost that support and that support at previous candle wicks around the $8 level may be on the cards. That continues to be the case.


$dot
Last week's TA & custom indicator

This week's TA & custom indicator
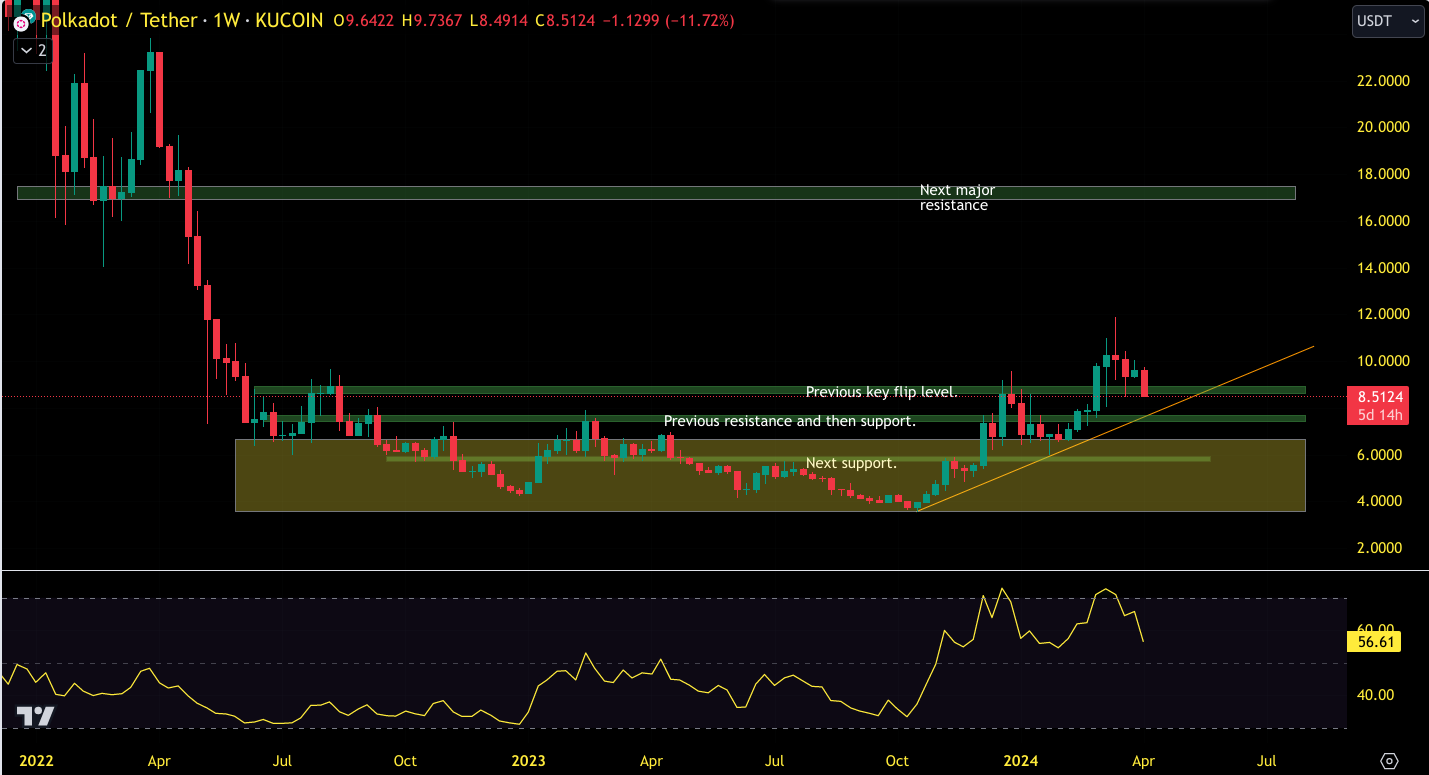
Last week I noted that the skies were now relatively clear for $dot up to the next major resistance at $17 but it seems likely that previous resistance turned into support at $8 may be tested again first, and that continues to be the case.


$grt
Last week's TA & custom indicator


This week's TA & custom indicator
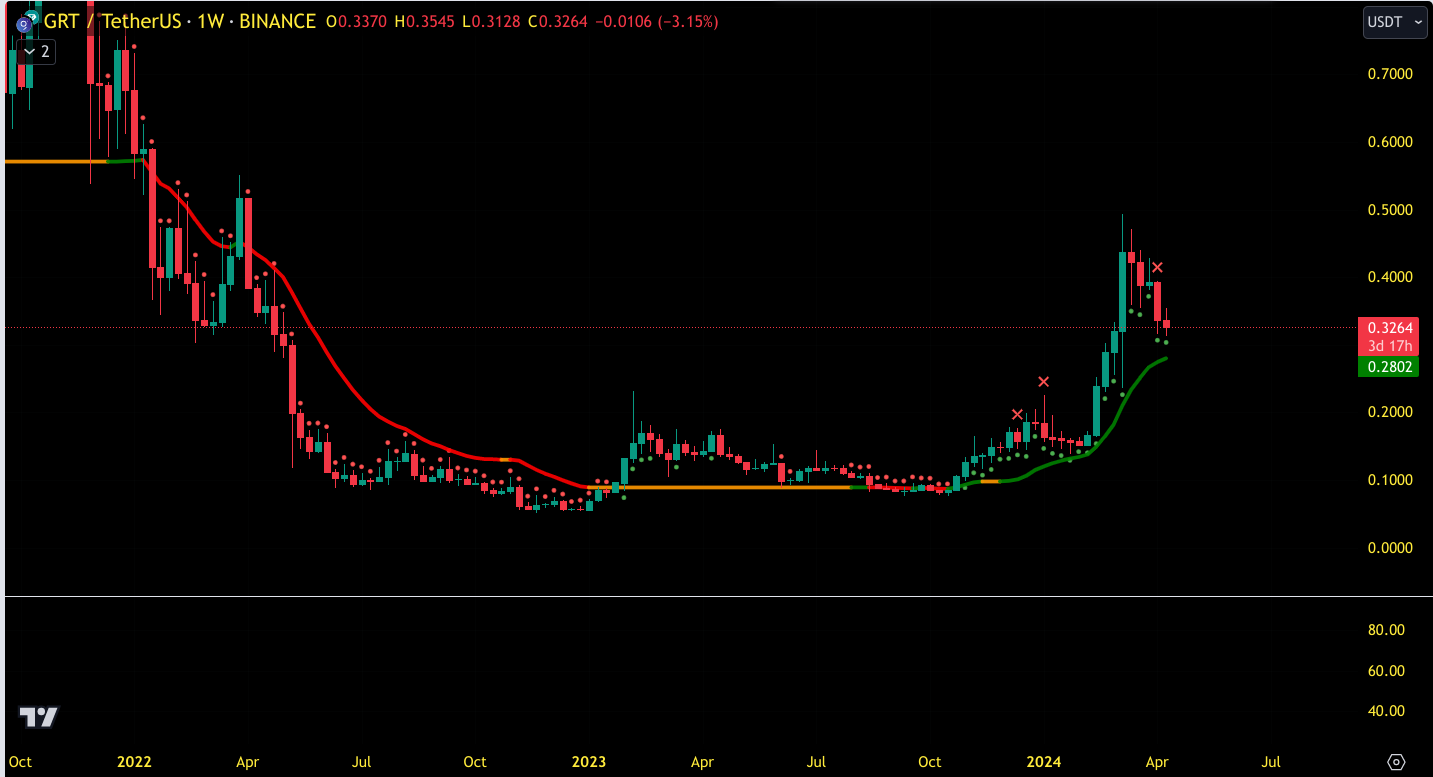
Last week I noted that we had seen a big push towards the next major resistance at the $0.5 level followed by a hard rejection, and that price may now retest the previous resistance again at the $0.3 level. That has played out over the past week .

$algo
Last week's TA & custom indicator


This week's TA & custom indicator
Last week I noted that price had rejected from the key flip level of $0.3 and the question now was whether previous resistance would continue to hold as support. That continues to be the case with price wicking below but candles closing above.


$hnt
Last week's TA & custom indicator


This week's TA & custom indicator
Last week I noted that $hnt had looked like it had broken back above a key flip zone but failed to turn it into support for further expansion upwards and the last few weeks saw price not only remain below that key flip zone level but back below previous resistance. Price is now dangerously close to closing below previous key support and the price trendline, and of that continues, old support at the $4 could be retested.


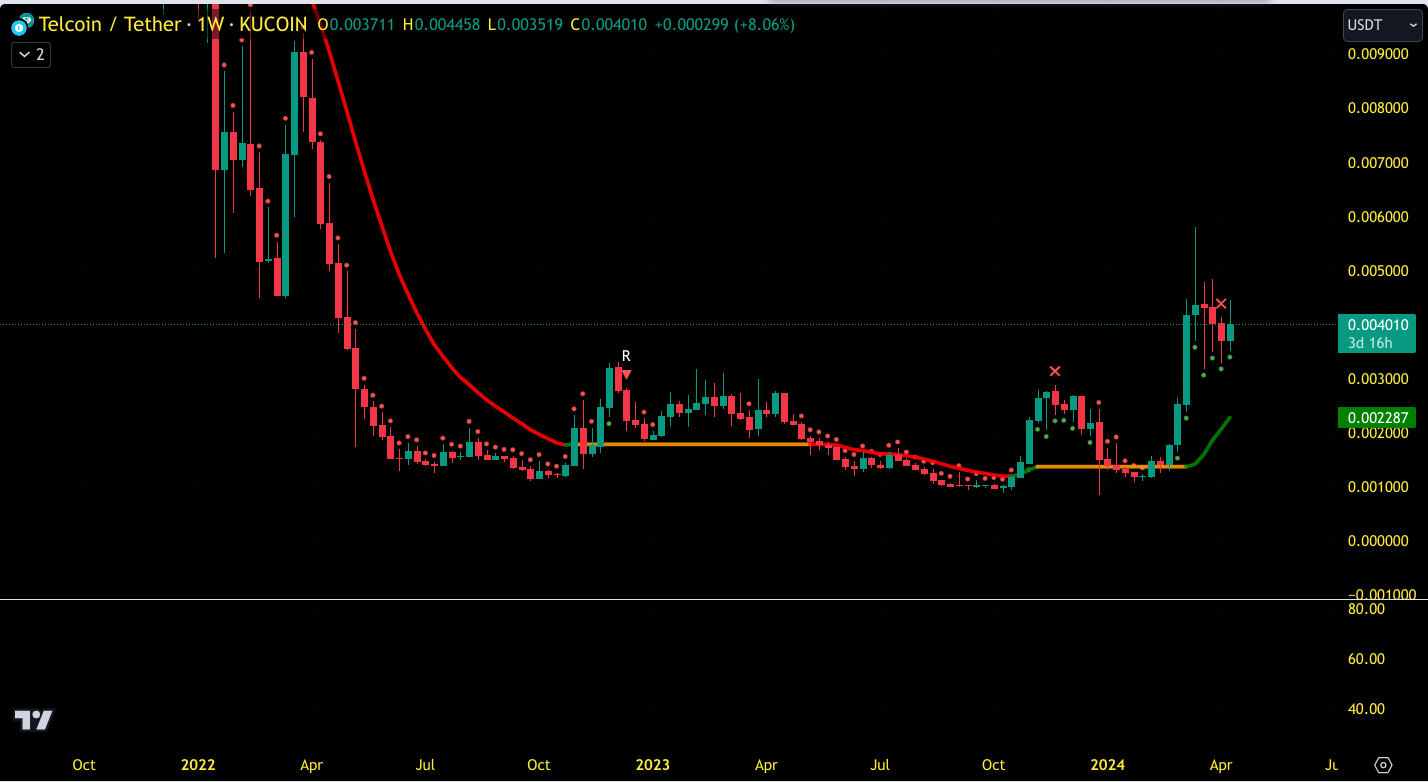
$tel
Last week's TA & custom indicator


This week's TA & custom indicator
Previously I noted that $tel had hit and rejected off the key pivot level of $0.005 and looked to be in the process of testing the key flip level again at $0.003. That continues to be the case with price currently ranging between $0.003 and $0.0045.

$xcad
Last week's TA & custom indicator


This week's TA & custom indicator
Last week I noted that price has failed to hold above the $1.5 level and was now at risk of losing the price trendline and heading back to the range low and, unfortunately, that continues to be the case.


$pyr
Last week's TA & custom indicator


This week's TA & custom indicator
Last week I noted that $pyr price action had been super clean, breaking out from its bear market range and then rejecting hard off key resistance. I also noted that price needed to convincingly flip that level to open the way for expansion upwards but was currently struggling to hold the price trendline. That has continued and price now looks like it might be going for a further retest of the top of the bear market channel.


$bax
Last week's TA & custom indicator


This week's TA & custom indicator
Last week I noted that $bax was ranging in a nother channel and that, having rejected off the top, there was a risk that it would retest the bottom, and that continues to be the case.


$doge
Last week's TA & custom indicator


This week's TA & custom indicator
Last week I noted that $doge's price, like many other meme coins, had broken out strongly and was now consolidating below the next key flip zone, which is a level i would like to see hold or price could return to the previous key resistance level. Price continues to perform relatively strongly and that flip zone is being held.


