


Food for Thought
State of the Current Market
1.1 Total Addressable Market
1.2 Challenges to the Current Market
1.3 Growth of Decentralized Finance (DeFi)
1.4 Requirements for DeFi Analysis Tools
1.5 Total Value Locked (TVL)DefiLlama
2.1 Introduction
2.2 Data
2.3 Methodology
2.4 FeaturesAlternatives: Dune Analytics & Token Terminal
3.1 Project Introduction: Dune Analytics
3.2 Project Introduction: Token Terminal
3.3 Case Study: Lido Finance
3.3.1 DefiLlama
3.3.2 Dune Analytics
3.3.3 Token Terminal
3.3.4 Reported TVLComparison
4.1 Similarities
4.2 Differences
4.2.1 Metrics & Insights
4.2.2 User Traffic
4.2.3 Social Media Engagement
4.2.4 Data Customization
4.2.5 Features
4.2.6 Chain Support
4.2.7 Vision
This article will give an introduction to decentralized finance (DeFi), and on-chain data analytic tools that can be used to assess DeFi projects. We will take an in-depth look at Defillama, and also other alternatives.
0. Food for Thought
As the DeFi market grows, there is a strong requirement for data analytic and visualizations tools to provide valuable insights into the ecosystem.
Current available tools provide real-time information on a wide range of blockchains and projects with varying degrees of analytical depth catering for a spectrum of users, from beginners to professional investors.
However, such tools require users to have varying degrees of financial literacy and coding language literacy. Depending on the user requirement, these tools may only be customizable to a certain extent.
On accuracy, these tools are not immune to errors since software developers, community or paid, are the human input behind these queries, and humans are not beyond making errors.
The focus on Total-Value-Locked (TVL) as a performance metric may be misleading as this would be a strong indicator of interest in the project, possibly on the yield generation aspects, but not on the security aspects of the smart contract. Most would assume that if there is such a huge amount of TVL in a project, someone would have audited the smart contract and have certified it to be safe, a herd mentality at best. This mentality of leaving the heavy lifting to “others” has caused many to lose assets through hacks of DeFi protocols in the past year, making many lose confidence in the space.
Platforms may also use a slightly different methodology in their calculations of TVL, which may not be a huge problem as long as there is legitimacy in the differences. Using the example of Lido Finance, investigative work may have to be done to make sense of differing figures.
Overall, on-chain data analytics and visualization tools are valuable DeFi insights and analysis, but users should be aware of its limitations and always exercise caution when making investment decisions based on the insights it provides, DYOR.
1. State of the Current Market
1.1 Total Addressable Market
Financial services play an important role in our global economy, facilitating transactions, loans, insurance, investments and cash flow management. These financial services become increasingly pivotal in financing global trade through cross-border payments in a connected global economy. Consumers tap into the financial system through our everyday activities, from taking out a mortgage loan for a housing loan, to receiving salary payments and paying for a meal. According to the Business Research Company, the global financial services market size has expanded from $23.31 trillion in 2021 to $25.83 trillion in 2022 at a compounded annual growth rate (CAGR) of 10.8%, and is expected to reach $37.34 trillion in 2026 at a CAGR of 9.6%.

1.2 Challenges to the Current Market
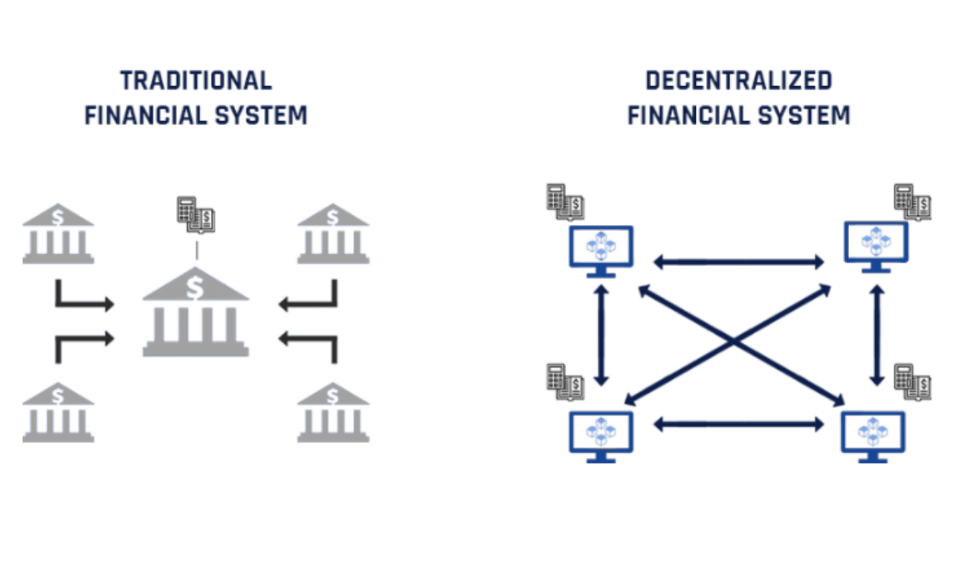
Historically, these essential functions have been facilitated by financial intermediaries, with strict oversight by banks, regulatory authorities and governments. With the authority that these intermediaries and regulatory entities can wield, there exists a centralized control over the financial markets that require market participants to place trust in these entities for the financial system to function properly.
However, there is a growing sentiment that such a centralized traditional financial (TradFi) system has negatively impacted market participants, including a lack of transparency with internal processes, limited accessibility to the banking system for those in the developing world, inefficient processes with high transaction costs and slow transaction times, and vulnerability to corruption and fraud due to the concentration of power and control in the hands of a handful of entities.
This has severely undermined trust in the current TradFi system, and has led to a growing demand for an alternative that is more secure, transparent, and accessible.
1.3 Growth of Decentralized Finance (DeFi)
The perils of the TradFi system has fueled the growth of decentralized finance (DeFi), an alternative financial system built on blockchain technology.
The vision of DeFi is to create open, transparent, and accessible financial systems by using smart contracts to automate financial transactions and provide users with greater control over their assets and data without the use of intermediaries. The DeFi ecosystem aims to replicate the functions of the TradFi services using decentralized exchanges, lending and borrowing platforms, stablecoins, and insurance protocols, among others.
According to Emergen Research, the decentralized finance market size is expected to expand at a compound annual growth rate (CAGR) of 43.8% from 2023 to 2028 to reach 507.82 billion in 2028.
1.4 Requirements for DeFi Analysis Tools
While blockchain technology has huge potential to disrupt the current TradFi systems, the exponential growth of DeFi projects and their decentralized nature has made it difficult for market participants to track each project efficiently to keep up.
There is a strong requirement for data analytic tools to capitalize the transparent nature to collect, process, and analyze on-chain data related to DeFi activities. Such information include user activity, transaction volumes, network usage, token prices, and various other metrics that provide insights into the health and usage of DeFi platforms and protocols.
The goal of using such tools is to provide investors, traders and developers valuable insights into the current DeFi ecosystem, identifying trends, tracking adoption and evaluating performance of projects and protocols, as well as to monitor the health and stability of the DeFi market as a whole.
1.5 Total Value Locked (TVL)
One of the most commonly used metrics used to assess DeFi projects is Total Value Locked (TVL), which measures the total amount of crypto assets deposited into the DeFi project. TVL is usually computed based on the amount of assets locked in smart contracts such as proof-of-stake pools, lending pools, and liquidity mining pools.
TVL measured at any one time may not give much insight to the DeFi project, the growth in the TVL, especially compared with alternative projects, can indicate strong user interest and activity in the project.
2. DefiLlama
2.1 Introduction
DefiLlama is one of the most widely-used analytics dashboards that aggregates the TVL for DeFi projects across multiple blockchains. The platform started with a commitment to maintain non-biased accurate data, transparency and independence without monetization through advertisements and sponsored content. DefiLlama aims to be a one-stop platform, providing free-to-use analytics for the users.
According to official documentation, DefiLlama expresses to “pride ourselves in producing inclusive, non-biased, and community driven statistics for the decentralised finance industry. We do our best to treat all projects equally with regards to what is and isn't included in TVL, how long it takes to list or update a project's TVL, and everything else.”
2.2 Data
The data presented on the dashboard is maintained by a team from their respective communities and coordinated through the DefiLlama Adapters and Github repository.
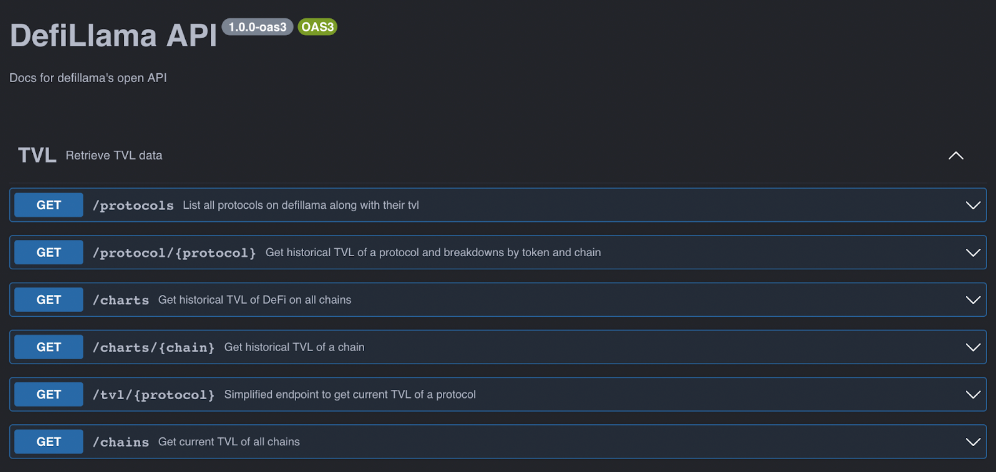
DefiLlama collects data on a protocol by the use of API endpoints and through making blockchain queries, and has made these available for the projects to use.
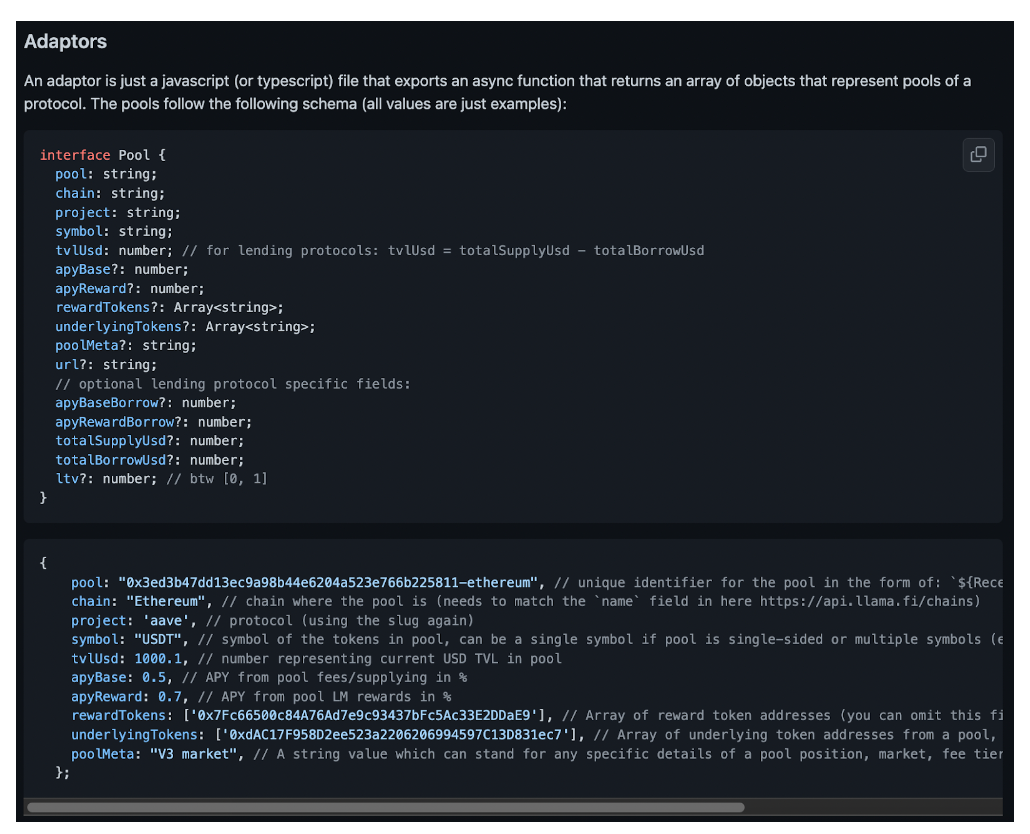
The team has also developed a SDK to assist DeFi projects write adapters to list their projects on DefiLlama. An adapter is basically code that takes in a UNIX timestamp and chain block heights, and returns the balances of assets locked in a protocol, including all the decimals The SDK will convert all raw asset balances into their USD equivalent and sum to obtain total TVL, which is presented in the dashboard.
2.3 Methodology
In their documentation, DefiLlama lays out clearly their methodology of calculating what should go into the TVL, including the use of Coingecko’s API for live prices, not counting locked tokens, not double-counting within the same protocol, not counting native token staked, and not attributing TVL into for cross-chain bridge projects.
For APY methodology, DefiLlama dives into more details in Github, where the calculations take a conservative route by “minimum attainable yield values for all listed projects” by omitting pre-mined and locked rewards, omitting yields that is dependent on locking up other tokens, using lower bound rates, resetting values when experiencing rewards slashing for early withdrawals,
2.4 Features
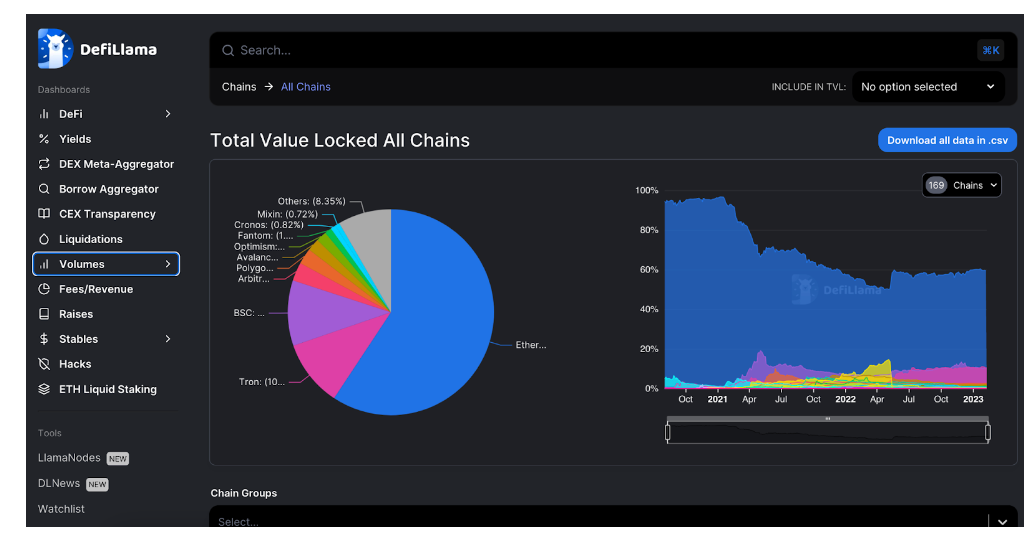
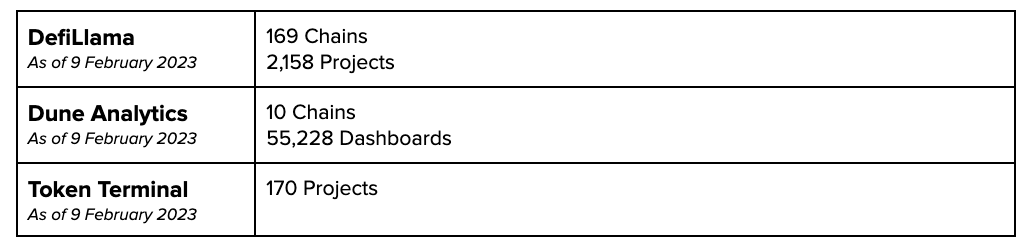
DefiLlama currently provides data on 2,158 projects on 169 blockchains.
On the homepage, DefiLlama displays an aggregator dashboard showing the constituents of all TVL across all chains, categorized by their native chains in a pie-chart format. Going into each option on the sidebar, more information is displayed about the specific category, for example as shown below for “DeFi”.
Interesting sections to explore include:
Yields, tracking 7993 lending pools over 248 protocols on 56 chains, which allow users to filter for suitable pools with preferred strategies
DEX-aggregator, suggesting the best route to perform a swap based on net output after gas fees
Raises, tracking investment rounds for DeFi projects, categorized by funding amounts and VC investors
Hacks, tracking hacking breaches DeFi projects, categorized by hacked amounts
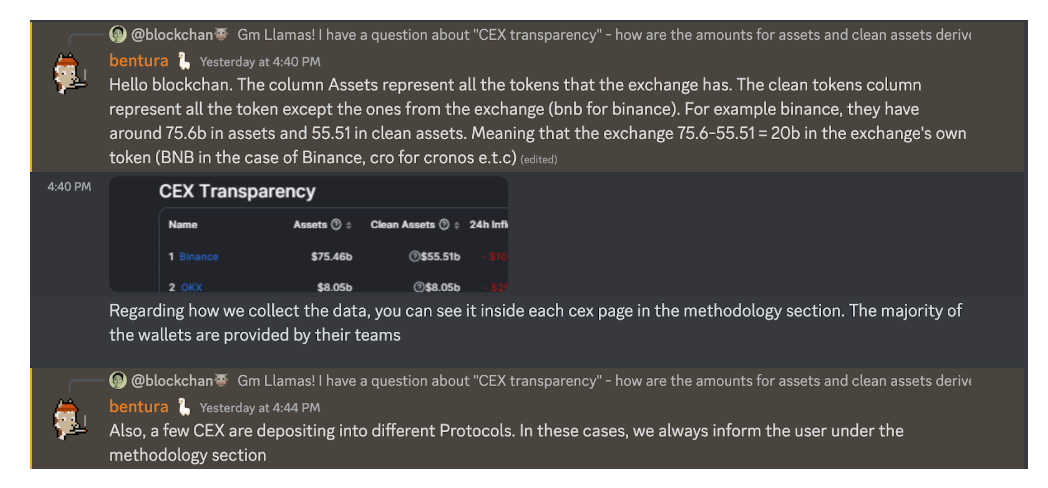
CEX Transparency, ranking TVL of centralized exchanges
3. Alternatives: Dune Analytics & Token Terminal
There are other on-chain data analysis tools in the market like DefiLlama, we will go briefly into two of such platforms, Dune Analytics and Token Terminal.
3.1 Project Introduction: Dune Analytics
Dune Analytics is a widely-used data visualization and analytics platform that lets users create, publish and access data dashboards driven by blockchain data. The platform is mainly community-driven, with popular user-created dashboards to track anything from the most trending yield farms on Ethereum and the non-fungible token (NFT) collections traded by top OpenSea marketplace traders.
Dune is currently free-to-use to create dashboards and publish your own datasets or view the work produced by others at no additional cost. The platform pulls the blockchain data produced by the Structured Query Language (SQL) query, and displays the data visually through the use of charts and tables.
3.2 Project Introduction: Token Terminal
Token Terminal is a data analytics platform for crypto assets, providing tools to analyze crypto assets through the application of traditional financial and business metrics.
The platform is developed through the belief that blockchains and projects are fundamentally similar to traditional companies, using an-internet-native business model to generate value to benefit users and owners. Most blockchain projects are programmed, owned and operated by global communities through token ownership, the platform believes that such projects can be valued and assessed in the same way stock in a traditional company gives its owner access to economic incentives and governance rights.
3.3 Case Study: Lido Finance
Let’s take a look at how DefiLlama, Dune Analytics and Token Terminal present the same project, Lido Finance for example.
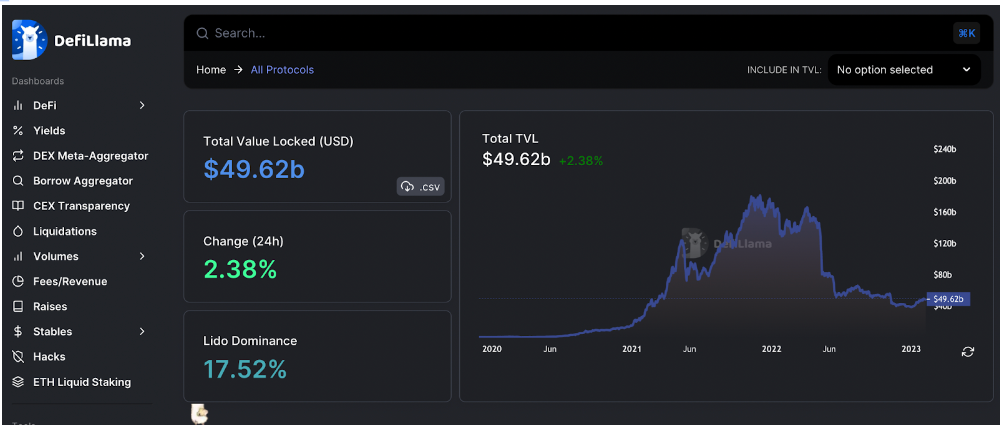
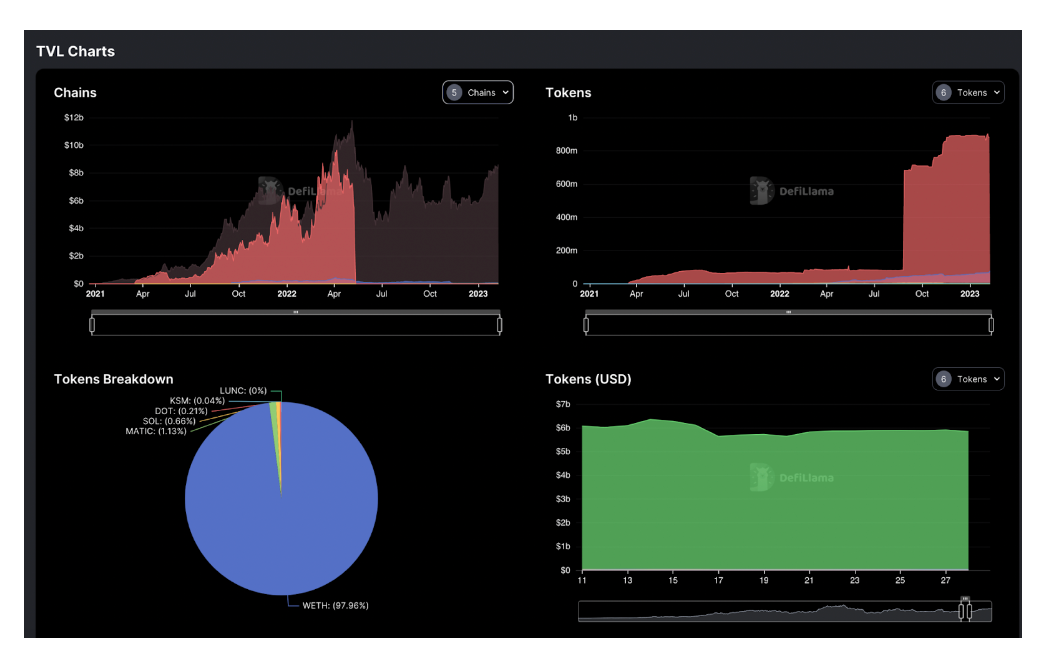
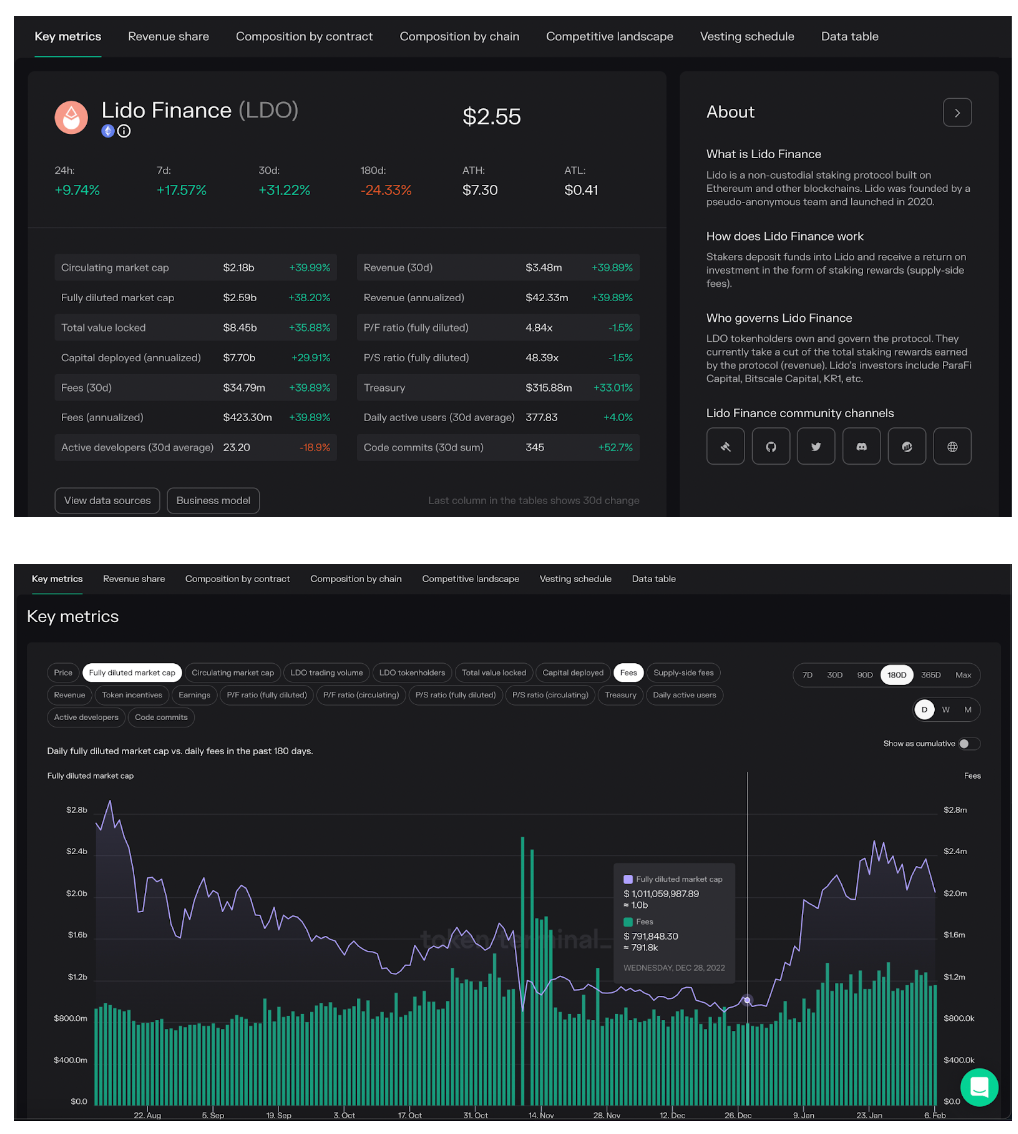
3.3.1 DefiLlama
This is how DefiLlama presents the TVL and tokenomics of Lido Finance.
3.3.2 Dune Analytics
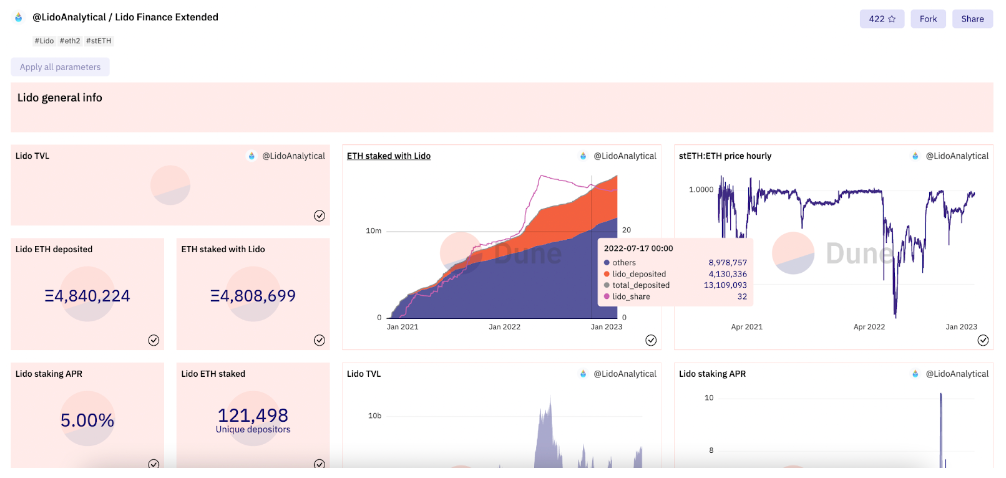
There are 16 user-generated dashboards referenced to Lido Finance, and one official dashboard generated by the Lido Finance project under username @LidoAnalytical.
This is the official dashboard developed by @LidoAnalytical.
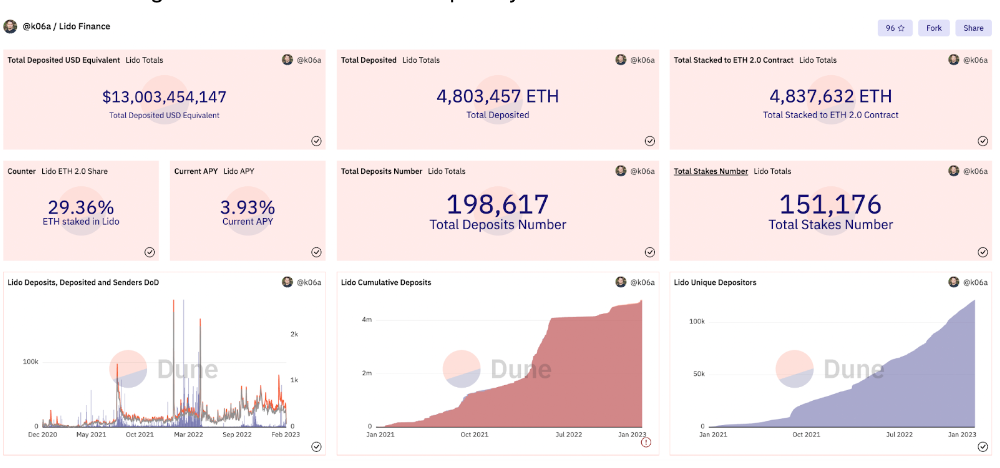
This is a user-generated dashboard developed by @k06a.
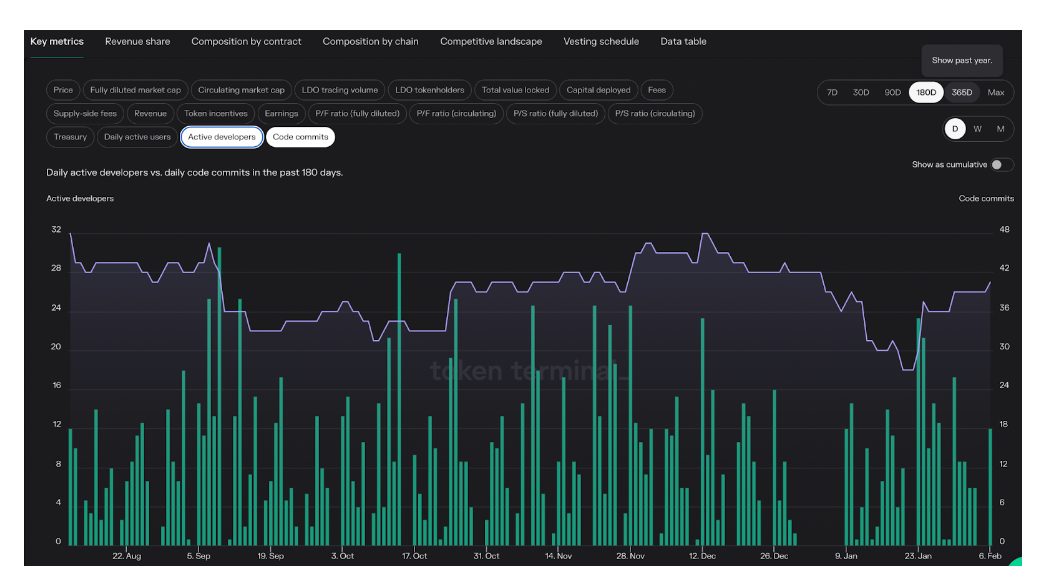
3.3.3 Token Terminal
This is how the Lido Finance project is presented on the Token Terminal platform.
3.3.4 Reported TVL
For comparison, these are the reported TVL figures across the three platforms, compared to reported figures on the official Lido Finance website.
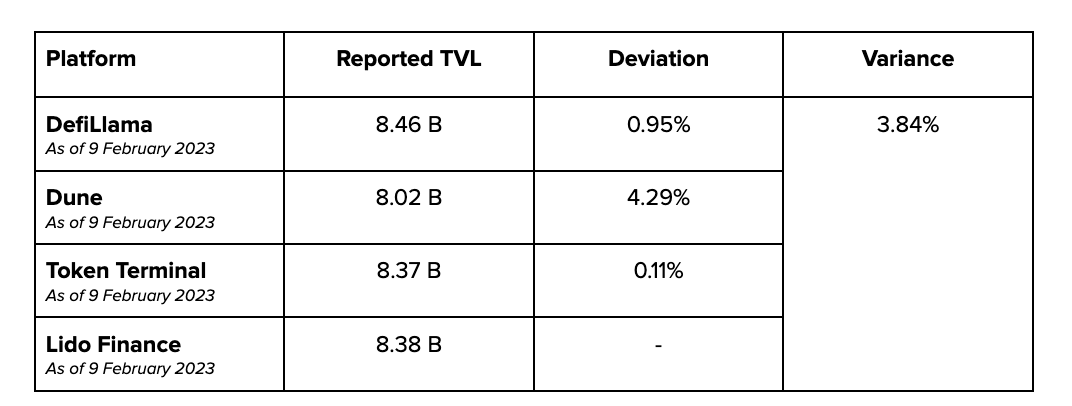
If the official Lido Finance website TVL figure is taken to be accurate, Token Terminal reports the closest figures.
The deviation for Dune could come from the fact that the platform does not support the Polkadot chains for Polkadot and Moonbeam staking, and that the query does not include assets deposited into the Polygon chain. Another potential reason for the deviation is that the Dune query only includes addresses where assets are deposited into the ETH staking pool, which does not include the staking rewards generated (~36 M). Taking these possibilities into account, the TVL figures would be bumped up to ~8.38 B, exactly what the official website is reporting.
The reported figures on DefiLlama aggregates the TVL for ETH and MATIC, where “stMATIC is counted as Ethereum TVL since MATIC is staked in Ethereum and the liquidity token is also issued on Ethereum.” Still, the figure is deviating almost 1.0%, which is substantial. One possibility could be attributed to double-counting of MATIC (~83 M). If that is accurate, the TVL figures would be adjusted up to ~8.38 B, exactly what the official website is reporting. Another possibility could be that there are unstaked ~32,000 ETH tokens that are deposited into Lido Finance, adjusting for these the TVL figure would be bumped up to ~8.40 B, closer to the official reported figures.
4. Comparison
4.1 Similarities
All three platforms provide data analytics and visualization tools to make it remarkably easy for users to analyze project performance, gain insights on tokenomics and TVL.
These platforms have versions that are free-to-use, and mostly intuitive in user interface.
The methodology of calculations are clearly stated in the project pages for each platform.
The development team for the projects are active in responding to requests from users to list new projects.
4.2 Differences
4.2.1 Metrics & Insights
All three platforms express that user metrics are not available for public use. Website traffic is used as a measure of traffic, as all three platforms are not on-chain application platforms where user metrics and activity can be queried from the blockchains.
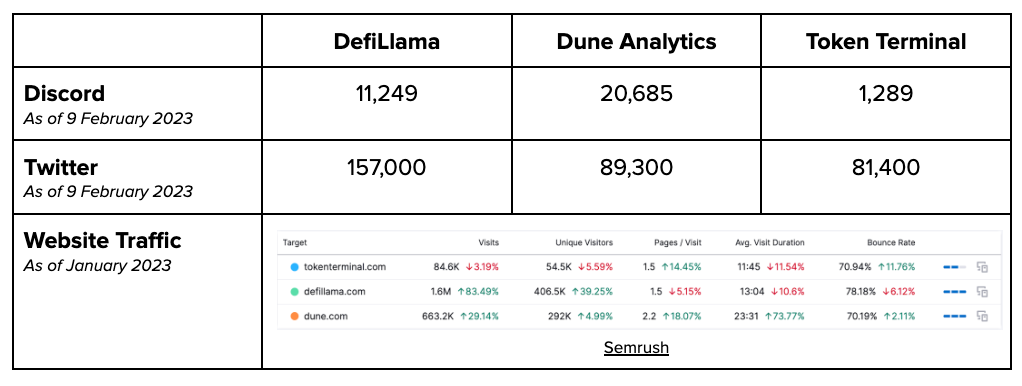
4.2.2 User Traffic
DefiLlama seems to be the most popular platform amongst the three with 1.6 million visits in January 2023, with users averaging almost 4 visits a month, spending an average 13 minutes on the platform.
Dune users spend about an average 23 minutes on the platform, almost twice as much as the other two platforms. This makes sense as a portion of the users are SQL developers using the platform to query the blockchains for data, and creating visualization dashboards.
Token Terminal logged the lowest numbers for user traffic, which may make sense because given the nature of their paid subscription. On the official website, it states that the platform has over 10,000 active users
4.2.3 Social Media Engagement
Dune has the most members in its Discord group, which makes sense since a portion of their users are developers requiring support as they write queries for their dashboards.
DefiLlama has the most following on Twitter, where users can be kept updated on new protocols listed on the platform.
4.2.4 Data Customization
Dune provides the widest range of customization for data analytics and visualization, especially for SQL developers familiar with querying datasets directly from the blockchains. The possibilities are almost endless, as long as the code works.
On the paid account, Token Terminal allows for creation of custom charts comparing projects, using preset parameters and without having to access the data directly from the blockchain.
DefiLlama dashboards are mostly preset, without much road for customization other than filtering for projects according to desired parameters. This would make sense because the users they are targeting tend to be more beginners into the space.
4.2.5 Features
The features presented by all three platforms are mostly similar, other than some key ones that would be highlighted in this section.
Token Terminal includes daily user activity, active developers and code commits for the projects. These are helpful metrics that indicate the strength of the community and traction amongst users and developers.
DefiLlama is constantly rolling out new features on their platform, one of which is the CEX transparency feature where doxxed CEX wallet addresses are queried for their balance of assets. The analysis goes one step further to subtract away tokens issued by the CEX from the balance, in the column “Clean Assets”.
While this goes a long way to establish health and transparency, there is a possibility where a CEX would have other wallet addresses which may hold leveraged positions, participate in DeFi lending protocols, or hold a large amount of issued tokens that bring the “Clean Assets” ratio down.
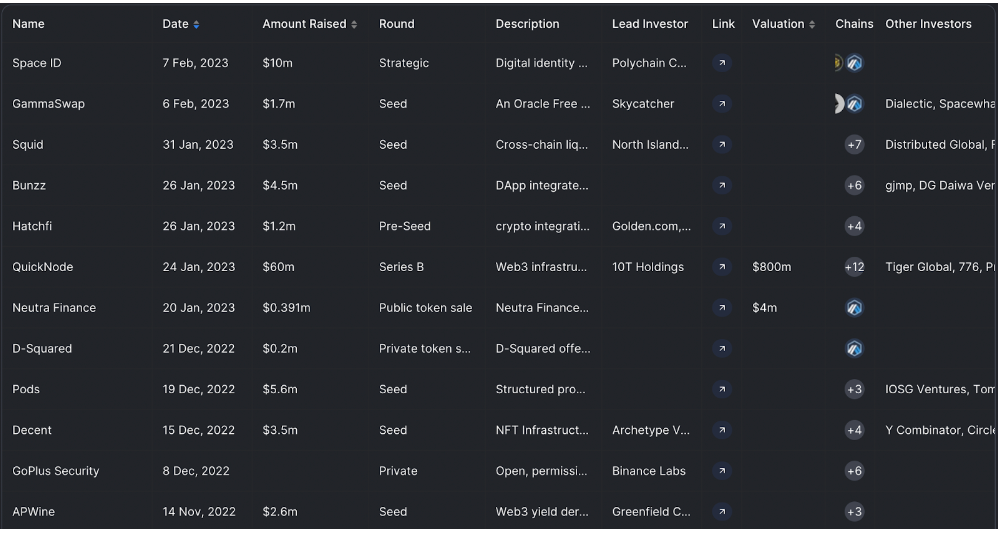
Another feature worth highlighting is the Raise feature, where the recent venture capital (VC) funding deals for projects are listed on the dashboard. Projects can be filtered by their native chains, investors, and funding amounts.
This seems to be more of a qualitative approach at establishing the credibility of new projects backed by different tiers of VCs, where many of these projects are early-stage, not yet listed on DefiLlama and without much DeFi quantitative data to draw insights from yet.
4.2.6 Chain Support
4.2.7 Vision
From the analysis of these three platforms, it is clear that the target audience and direction of the projects greatly differs.
Beyond on-chain quantitative data analytics and visualization, DefiLlama has expanded into other DeFi products and services notably like swap aggregator, reporting on funding and hacking, an media outlet in DL News, and operating validator nodes through LlamaNodes. Being able to analyze on-chain data, it seems that DefiLlama is deriving insights to develop new products and services, venturing out of purely DeFi analytics into aggregating information and building base layer infrastructure. Google, anyone?
For Dune Analytics, the direction seems to be developing the company in the mold of Github, a popular freemium software development platform, where a community of developers can build together. While the public dashboards are available for all user access, the ability to create dashboards requires an intermediate to advanced level of SQL coding skills.
For Token Terminal, the product interface seems to be targeting investors and market participants from the traditional finance space, venturing into the crypto assets space. The platform seems to be developing in the mold of Bloomberg, designed to deliver data and news across market sectors in a single one system to empower decision making.
