Amarii Rating Charts
Amarii Rating Charts Explained
The Amarii Rating System and the Global Macro Tracker and Play Sheet are premium powerful tools that can help investors make informed decisions about their investments. By combining the quantitative analysis of the Amarii Rating System with the qualitative analysis of the Global Macro Tracker and Play Sheet, investors can gain a comprehensive understanding of the current economic environment and make informed decisions about their investments.
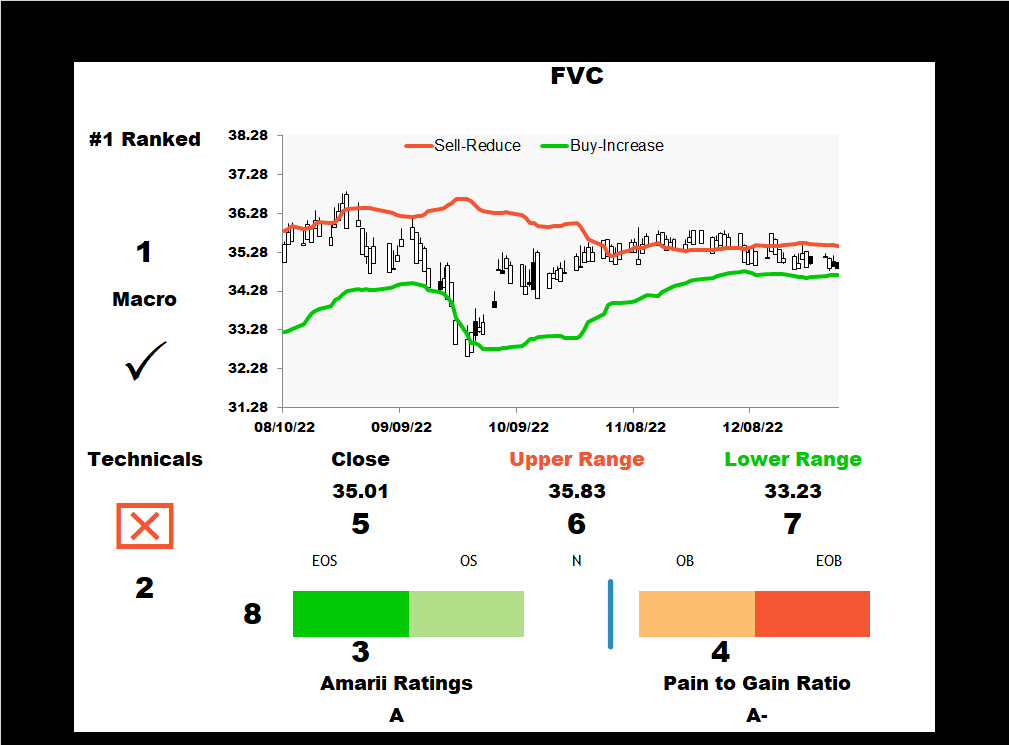
Macro: If the sheet is one of Debt, Industry and Market Segment, Currency, and Commodities Current Era and is in line with the Global Macro Tracker Position, a check arrow will appear if not an X will appear.
Technical: If the 50-day moving average is higher than the 100-day moving average, this indicates that it is a good time to enter a long position. Conversely, if the 50-day moving average is lower than the 100-day moving average, this suggests that it is a good time to enter a short position. If the Macro trend has a check mark and the technical indicators match, then it is very favorable to go long. If the trend is favorable for a short position and the technical indicators match, then it is very favorable to go short.
Amarii Ratings: The Amarii Rating System is a quantitative system that measures the performance of ETFs over the past 12 months, providing investors with a comprehensive overview of risk to reward ratios.
Pain to Gain Ratio: The Pain to Gain Ratio is a measure of the amount of effort required to achieve a desired outcome. It is used to determine if the effort is worth the reward.
Close: A stock's adjusted close is the closing price of a stock after accounting for any corporate actions such as dividends or stock splits.
Upper Range and Lower Range Adaptive Bands: Adaptive Bands are technical indicators that adjust to changing market conditions by widening or narrowing based on volatility and price.
Upper Range and Lower Range Adaptive Bands: If all conditions are met through macro and technical analysis, then entering a long position at the lower end of the range for the adaptive band would be a good idea. This means that the trader believes that the price of the asset will increase, and they are buying at a lower price in anticipation of this. Conversely, if the trader believes that the price of the asset will decrease, then entering a short position at the lower end of the range for the adaptive band would be a good idea. This means that the trader is selling at a lower price in anticipation of the price decreasing.
RSI: Relative Strength Index (RSI) is a technical indicator used to measure the strength of a stock's price movement. It is used to identify overbought and oversold conditions.