
Introduction
Osmosis is a proof-of-stake blockchain built on the Cosmos SDK, specifically designed to support decentralized exchanges and automated market maker (AMM) applications. As Osmosis uses the Cosmos SDK, it is an appchain on the Inter-Blockchain Communication Protocol (or the IBC). The Osmosis appchain operates primarily as a decentralized exchange (DEX) within an automated market maker (AMM) model. It does this by enabling permissionless trading of cryptocurrencies against liquidity pools. This allows users to exchange assets seamlessly without relying on traditional order book market makers.
On the supply side of Osmosis’ model are liquidity providers (LPs), deposit tokens into liquidity pools and faciliate trades. Asset prices within these pools are determined by formulas, which can be customized based on the specific pool. To incentivize users, Osmosis offers rewards in OSMO and other tokens depending on the liquidity pool.
The OSMO token serves multiple purposes within the Osmosis ecosystem, like staking, governance, and paying transaction fees. As the base token, OSMO plays an integral role in driving the growth and development of the Osmosis blockchain, making it an essential component of this innovative and dynamic decentralized exchange platform.
About This Report
This report aims to break down Osmosis and the appchain’s native token OSMO using fundamental metrics. The goal of this report is not to provide investment advice for or against the OSMO token, nor is it to encourage or discourage the use of the appchain itself. We aim to give the reader a fundamental lens to analyze the protocol.
Our approach to this analysis can be categorized as:
Operational Analysis:
Osmosis’ core operations are that of an exchange, which performs two functions:
• Facilitates a swap
• Provides liquidity to LPs
These two functions allow the appchain to operate. For this, the two main categories of quantitative metrics to look at are – swaps facilitated and value-locked within the protocol.
User Analysis
Osmosis caters to users on the:
Supply-side in the form of Liquidity Providers
Demand side in the form of Traders
To understand the stickiness of these customer cohorts, we will be looking at – new addresses, active addresses, and user retention on a daily to monthly basis.
Financials
Osmosis functions as a DEX, but operates as an independent appchain within the IBC. Hence, we will break down its revenue as:
Revenue generated from transaction fees paid
Revenue generated from the swap fee paid
From revenue, we aim to calculate the costs incurred by Osmosis in paying the LP's yield on their deposits and arriving at the bottom line for the appchain.
Market Data
Osmosis’s native token can be used to pay, which has the utility of a native token as well as a governance token to vote on proposals. Given this utility baked into the token, we look at – price data and look at valuation metrics for the Osmosis appchain.
Operational
From an operational perspective, Osmosis blockchain's performance can be assessed through various metrics, such as:
Transaction volume
Liquidity pool depth
Network fees,
The efficiency of its automated market maker (AMM) algorithms
Analyzing these metrics allows us to understand the overall health and efficiency of the Osmosis appchain. Further, it allows us to understand the ability to provide users (swappers and LPs) with a seamless and cost-effective trading experience across different blockchain networks

Over the past year, the Osmosis decentralized exchange (DEX) demonstrated notable growth in trading volume and swap counts. The appchain reached its peak trading volume on December 26, with an impressive figure exceeding $102 million. This upward trend indicates a growing interest in Osmosis as a preferred destination for trading cryptocurrencies within the Cosmos ecosystem, highlighting its increasing significance within the decentralized finance (DeFi) landscape.

Analyzing the operational perspective of Osmosis DEX using trading fees and average trading volume as metrics reveals interesting insights. The daily trading fee on Osmosis DEX has demonstrated a pattern similar to the trading volume. The highest amount of daily fee occurred in the second week of December 2023, indicating peak trading activity and revenue generation for the platform.
The daily trading volume on Osmosis was under $50 million for the better part of 2023, (barring a single blip on April 23). Only in December 2023, did the appchain see over $50 million in daily trades for consecutive days. In 2024, > $50 million days were more regular. Over the past two completed months of the year, Osmosis did 3.5-4x the trading volume of the same months of 2023. In fact, the first half of March 2024 saw volumes of $1.1 billion, or nearly three times March 2023's trading volume, which is a staggering growth.

Take rate, which is derived by dividing trading fees by trading volume, serves as a vital metric for evaluating the cost-efficiency of a decentralized exchange platform like Osmosis. The take rate for a DEX unlike a CEX is a dynamic number that changes based on the degree of demand (trading) to supply (provision of liquidity). This is computed by dividing the trading fees, by trading volume in USD terms. As seen from the chart above, Osmosis’ take rate is falling, which shows a higher degree of growth in the volume of the trading fees (from swaps) generated.
For the first 9 months of the year, the take rate was stable at 0.2%, but then on it fell to 0.1% and below. This was likely when Osmosis introduced taker fees of 0.1% on DEX orders, following which fee generated from swap fees directly declined as a result.
Users
Osmosis’ users are two-fold, divided between supply-side contributors (LPs) and demand-side swappers (traders), like any other DEX operating an AMM model.
On the demand side, we measure active addresses on the appchain using metrics like – Daily Active Users (DAU) to Monthly Active Users (MAU) ratio, swaps per trader, volume per trader, average deposit volume to liquidity pools, and retention cohorts.
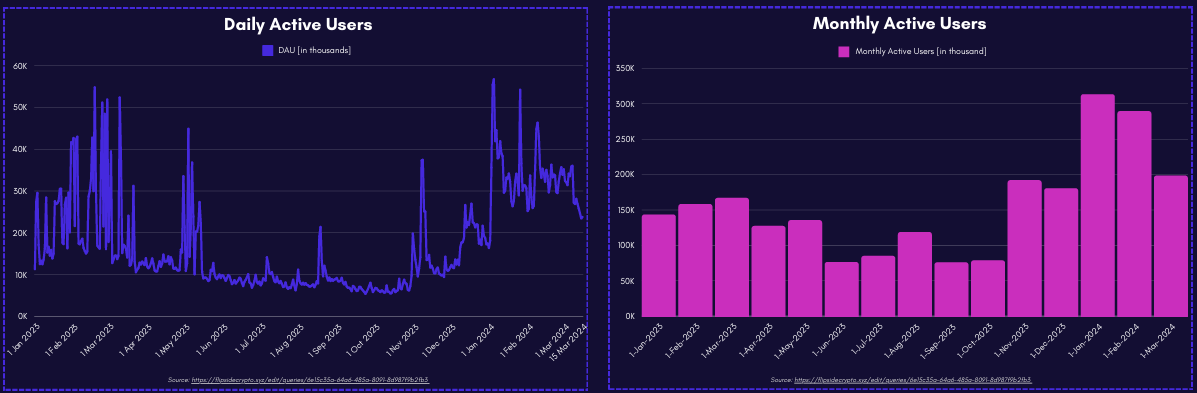
Osmosis witnessed a significant surge in trader activity, as evidenced by the increasing number of daily active users since late 2023. The day with the highest number of active unique users was on January 4, 2024, when over 56k users were in the Osmosis Zone. This was after a slew of airdrops on the IBC network that went to OSMO stakers and resurging trading activity in the last quarter of 2023.
January 2024, on average saw 36k users every day, which is nearly 60% higher than the same month last year. This trend continued in February and March, with 32k and 30k (first 15 days of March) daily active and unique users in the month.

Osmosis demonstrated impressive growth in attracting new users, with a total of approximately 298,000 unique addresses joining the platform in the past 30 days, on average. To put that in perspective, that’s nearly 5k new addresses every month. New addresses have slipped off its growth trend of over 20k new addresses in early February to under 10k in March.

Here is where things ge interesting. For every trader that uses the Osmosis app, they make on average 20 swaps. This is notably higher than EVM DEXs, where swaps per address is between 10-15 per day. This metric is important for Osmosis to measure user utilisation. And it has been growing since January 2024, when swaps per user was below 10 and it has since improved to over 20, which means more users are making more swaps per day.
The same goes for the dollar volume of crypto assets exchanges. In fact, this shows a sharper increase. The volume per trader per day was below $5 for the first 11 months of last year. But with the crypto market’s upcycle, Osmosis saw increased volume. On average February 2024, saw $7.5k volume per trader per day, and this surged to over $10k per trader (on some days to $15k per trader) in March 2024. This has partly got to do with an increase in the value of crypto assets in the past 3 months. And since volume per trader is on a straight line up, while swaps per trader is yet to hit its peak, utilization grew mainly because of the rise in prices.
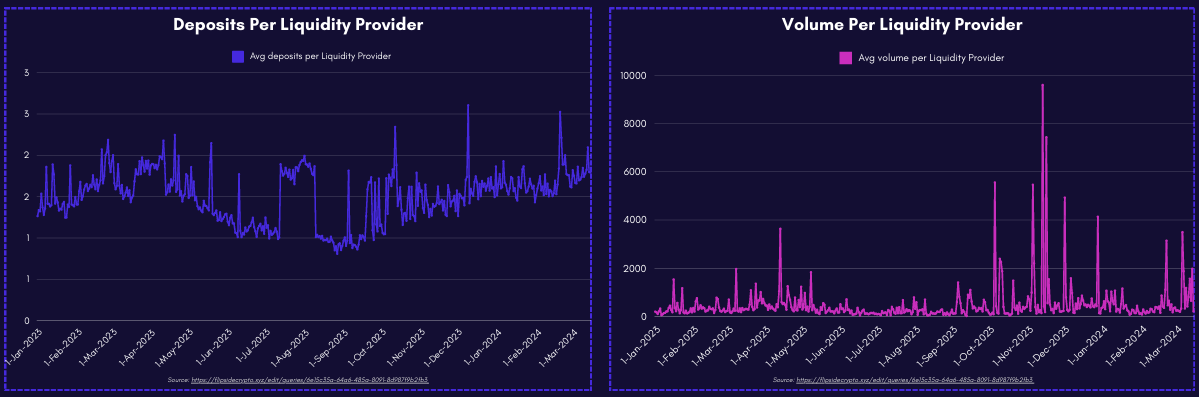
On the supply front, LPs are not returning in droves. The deposit count per liquidity provider (LP) remained muted at less than 2 deposits per day for the most of last year, sometimes falling below 1. This indicates that users are not flocking to supply liquidity to the Osmosis pools, due to unfavorable pool rewards, poor liquidity provision, or pool concentration. In Q4, Osmosis added a V20 update which introduced volume splitting across liquidity pools with – higher traffic and lower fees. This was aimed at increasing trading volumes and reducing fees. We can see this in a 122% increase in average deposits per LP from September 2023 to March 2024.

The big number right off the bat is the 1-year retention, which is close to 30%. Meaning 1 in 3 first-time Osmosis users stay after a period of 12 months since their first transactions. This number is significantly more healthy than EVM DEXs where the stickiness is low even in shorter time frames. This could be due to the plethora of options on EVM chains, and also the lack of consistent experience, in terms of network congestion and transaction fee fluctuation. Hence, the IBC and appchain model helps a Layer 1 blockchain like Osmosis, which provides the core function of swapping tokens for regular users to keep coming back.
Trading Pools
Trading pools play a pivotal role in the Osmosis decentralized exchange (DEX) ecosystem, as they provide the necessary liquidity for users to trade cryptocurrencies efficiently and securely. These pools enable seamless asset swapping and facilitate automated market-making, ensuring that Osmosis DEX can offer competitive pricing and low slippage for traders. Moreover, the customizable nature of Osmosis trading pools allows for tailored fee structures and incentivizes liquidity providers to contribute their assets, fostering a robust and decentralized liquidity network that underpins the entire platform's functionality.

The top 20 trading pools on Osmosis DEX showcase a diverse range of assets and liquidity options for users. The axl.USDC-OSMO pool takes the lead with the highest trade volume over the past year, while the ATOM-OSMO pool comes in at a close second. Axl.USDC is the wrapped version of the USDC stablecoin using Axelar.
Additionally, the table provides valuable insights into other essential aspects, such as swaps and unique traders, offering a comprehensive overview of the platform's liquidity and user engagement. These top-performing pools highlight Osmosis DEX's ability to cater to various trading preferences and contribute to its overall success within the Cosmos ecosystem.

The top 20 liquidity pools on Osmosis DEX, ranked by the number of unique liquidity providers, highlight the platform's diverse and thriving ecosystem. The ATOM-OSMO pool stands out with over 158,000 unique users contributing liquidity in the past year. This extensive participation reflects the pool's popularity and users' confidence in the Osmosis platform. The presence of other prominent pools further showcases Osmosis DEX's ability to attract liquidity providers and support seamless trading experiences within the Cosmos ecosystem.
Financials
A DEX’s main function is to facilitate a swap. For this, the DEX earns a swap fee. But beyond this, Osmosis’ also earns transaction fees like a layer 1 blockchain. These are the two main sources of revenue. We say main because Osmosis also earns a small portion of revenue on the B2B side by providing liquidity to token launches within the IBC ecosystem. However, this number is neither easy to calculate nor sizeable.
Generated trading fees, which are derived from user transactions, serve as a key revenue source for Osmosis. Additionally, assessing gross profit after deducting token incentives given to OSMO stakers helps in understanding the overall efficiency and effectiveness of Osmosis DEX's business model. Beyond this, OSMO stakers are also eligible for airdrops from projects within the IBC ecosystem. However, this accrues directly to token holders (through staking), rather than the protocol itself.

Since the beginning of 2023, Osmosis earned $8.1 million in trading fees. Interestingly, 31% of these fees came in the first quarter of 2023, with over $800k in trading fee per month between January to March 2023. These rest of the year (till December) saw muted generation of trading fees, at less than $500k in fee generated per month. With trading picking up in December, fees jumped to $840k, up nearly 4x from 3 months prior. The first quarter of 2024 will see close to $1.7 million in trading fee, which is 12% higher than the previous quarter, a strong start to the new year.

The outstanding [large] LP deposits, refer to deposits exceeding $100,000 in liquidity pools, provide a snapshot of significant liquidity contributions within the Osmosis DEX ecosystem. We’ve identified a list of 25 addresses which are the biggest suppliers of liquidity for Osmosis. These addresses supplied i.e. deposited a sum of 20 million in OSMO tokens, amounting to a deposit volume of over $13.7 million. Of this, the largest whale supplied 9.04 million OSMO, amounting to a deposit volume of $5.6 million, this was over 40% of the deposits, in USD and OSMO terms among large LP deposits.

To find the daily balance of the protocol revenue generated by Osmosis, the designated wallet address "osmo17qdmjdumw4xawam4g46gtwzle5rd4zwyfqvvza" – should be used, as stated in the official Osmosis documentation.
Osmosis earns revenue through four means:

Of these, in the past year, Osmosis began earning protocol fee only in March 2023 and Taker fee was switched on in October 2023.
From an overall revenue perspective, between January 2023 to the first half of March 2024, Osmosis generated $23.2 million in revenue. Of this over 90% came from two sources – swap fees and taker fees – both of which accrue to the DEX function and not the Layer 1 function of the appchain on the IBC network.
1 Jan 2023 1 Feb 2023 1 Mar 2023 In 2023, Osmosis’ revenue hovered between $500k to $900k on a monthly basis. Only in November (one month after taker fees were switched on) did monthly revenue move over the $1 million mark. Since then, revenue has comfortably exceeded not just $1 million per month, but $2 million per month. In the first quarter of 2024, Osmosis is expected to generated an overall revenue of over $12 million, almost equalling the total revenue it generated for 2023.
On a split basis, swap fees contributed nearly all of Osmosis revenue in early 2023 (the rest coming from transaction fee, less than 1%). By the end of 2023, swap fee’s contribution dropped to 58% of the total pie. The rest of the revenue mainly came from taker fee. Since its approval in October 2023, Osmosis generated $5.6 million in taker fee, or a third of monthly revenue.
Valuation
For this, we’ll be using the native token of the Osmosis appchain – OSMO – and using the following valuation ratios:
• Price to Fees: Market Capitalization / Trading fees
This helps to gauge the market demand for the OSMO token, based on the fee the appchain generates through its core activity i.e. trading.
• Working Capital turnover ratio: Trading Volume / Total Value Locked
This helps us measure the liquidity and operational efficiency of the appchain by its ability to generate volume (through swaps) using the pool of liquid funds in-hand.
• Return on capital employed: Trading fees / Total Value Locked
This helps us measure the liquidity and operational efficiency of the appchain by its ability to generate volume (through swaps) using the pool of liquid funds in-hand.
• Market Utilization: Market Cap / Total Value Locked
This helps us measure to what degree is the market over-valuing or under-valuing the appchain based on the value locked within it (as LP funds).

Market Cap/Trading Fees (price to fees) is a critical metric in evaluating Osmosis DEX as it reflects the relationship between the platform's market capitalization and the fees generated from trading activity. By assessing this ratio, stakeholders can gauge the platform's ability to generate revenue relative to its overall market value. A higher Market Cap/Trading Fees ratio may indicate that the market is optimistic about the platform's future growth potential. In comparison, a lower ratio could suggest that the platform's current revenue generation may not justify its market valuation. This metric helps investors and users understand the value proposition of Osmosis DEX within the Cosmos ecosystem and its ability to sustain growth and generate returns over time.

The Working Capital to Turnover ratio (Trading Volume/Working Capital) is a significant indicator for evaluating Osmosis DEX's operational efficiency and liquidity management. This metric assesses the relationship between the platform's trading volume and its working capital, which comprises current assets and liabilities. A higher Working Capital to Turnover ratio implies that Osmosis DEX is effectively utilizing its working capital to generate trading volume. This can indicate efficient liquidity management and a robust trading environment, which in turn attracts more users and fosters growth within the Cosmos ecosystem. Monitoring this ratio over time can provide valuable insights into Osmosis DEX's ability to maintain liquidity and support seamless trading experiences for its users.

ROCE (Return on Capital Employed), calculated as Trading Fees divided by Working Capital, is a crucial metric for evaluating Osmosis DEX's profitability and efficiency in utilizing its capital. This indicator measures the return generated from trading fees relative to the working capital invested in the platform. A higher ROCE suggests that Osmosis DEX is effectively generating returns from its capital investments, reflecting a robust and profitable business model. This, in turn, contributes to the platform's attractiveness to users and investors within the Cosmos ecosystem. By monitoring ROCE over time, stakeholders can assess Osmosis DEX's ability to maintain strong profitability, optimize capital utilization, and foster sustainable growth in the decentralized exchange landscape.

Market Cap/TVL is a significant metric for evaluating the valuation of Osmosis DEX, as it compares the platform's market capitalization to the total value locked (TVL) within its liquidity pools. This ratio provides insights into the relationship between the platform's overall market value and the amount of assets committed by users to facilitate trading activities. A higher Market Cap/TVL ratio may indicate that the market is optimistic about Osmosis DEX's growth potential and prospects, leading to a higher valuation relative to the TVL. Conversely, a lower ratio could suggest that the platform's market value is not fully reflecting the level of user commitment and liquidity provision within its ecosystem. By monitoring this metric, stakeholders can assess Osmosis DEX's attractiveness to investors and its ability to maintain a competitive edge within the decentralized exchange landscape.
Market Data
From a OSMO tokenholder perspective – what determines the value of the token? A few things – governance participation, transaction completed, and total number of swaps. Each of these functions are paid for in OSMO token, which is used to pay out – LPs, stakers, and the community. Given the increase in the overall revenue of Osmosis (particularly because of the introduction of taker fees), the value accrual is evident in the price of OSMO.

After hitting a low of $0.2 in October 2023, OSMO strongly rebounded to pushing past $1 less than two months later. Before this, the token traded above $1 for less than 3 weeks earlier in the year. This surge continued in 2024, with the token trading between $1.5-2. At it’s peak Osmosis hit a market cap of $1.2 billion.
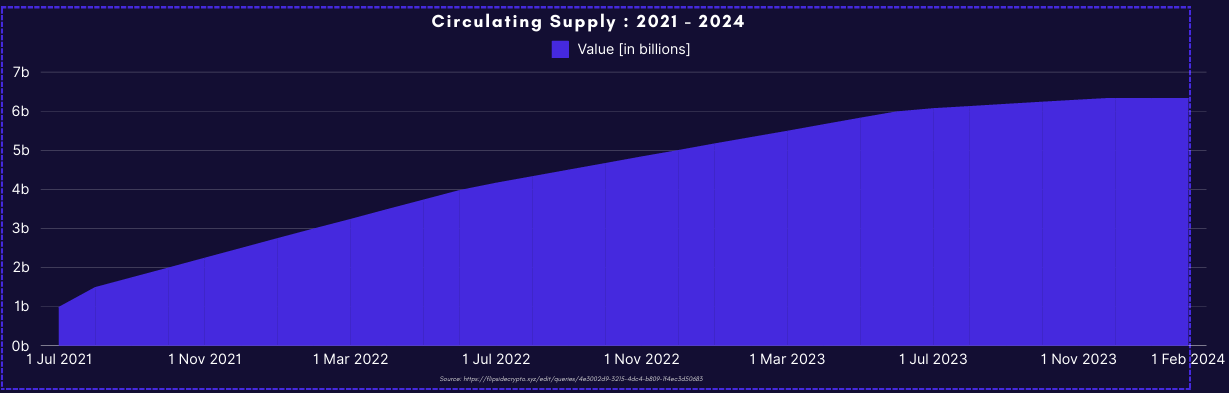
Unlike most L1 tokens, Osmosis’ native token has a fixed cap of 1 billion tokens. Further, to control the supply, the Osmosis foundation has included a supply schedule, called the thirdening, where new token supply will fall by a third every year. Since the launch in 2021, Osmosis’ new token supply declined every year leading to a flattening of the circulating supply curve, much like Bitcoin’s supply which follows the halvening reduction to its supply schedule.
PYOR Is An Interpretation Layer For Digital Assets. Go beyond the surface level with our data product XRAY. Check out XRAY → pyor.xyz
