
W3A PRO | 🚨 Crypto Markets are About to Turn
30 Charts Showing the Stars are Aligning for Crypto Markets
Kyle Reidhead
11 min read·
GM PRO DOers!
🚨 I’m sounding the alarm. 🚨
The stars are aligning across various realms of market analysis.
We appear to be reaching an inflection point in markets, and my spidey senses are tingling.

I’m going to break it all down with charts in just a second. But here’s why this matters…
Back in January of this year (before PRO was launched), I was screaming on the Web3 Academy podcast that it was time to seriously enter the markets.
It was a time when inflation worries were immense, interest rates were going the wrong way, the FTX collapse was less than 2 months old, and the sentiment in crypto and broader markets was terrible.
Even though most people thought the world was ending, if you looked under the hood, the stars were aligning across various realms of market analysis.
Forward-looking macro numbers, technical analysis, and sentiment all pointed towards one thing; markets were ready to make a big move to the upside.
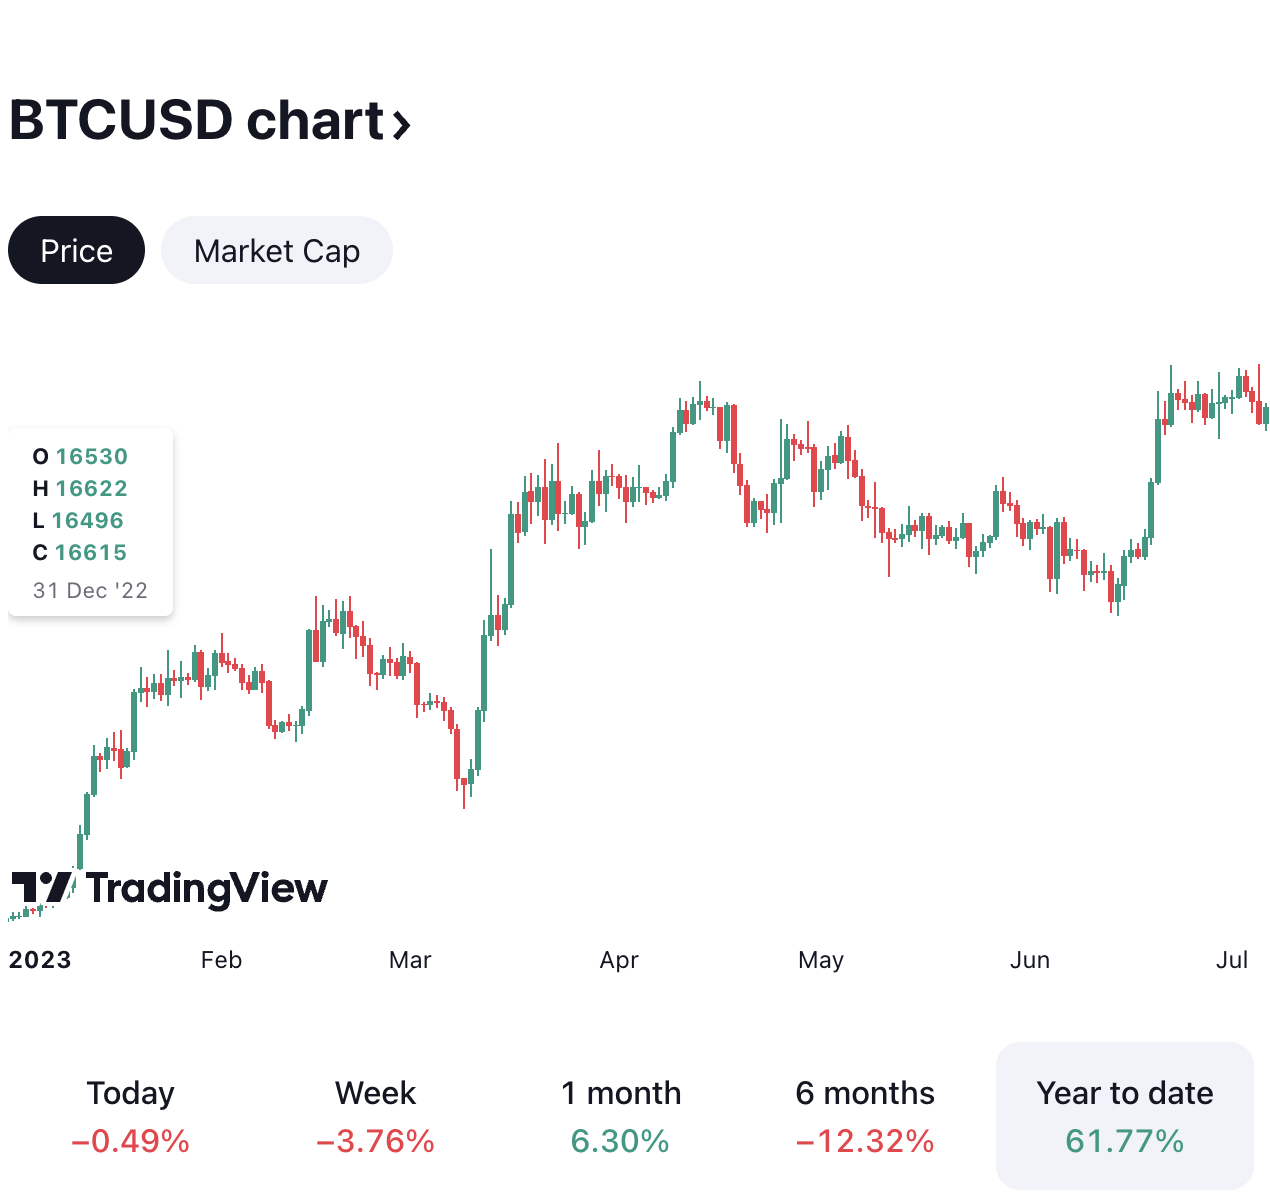
Despite the consensus being that we were heading much lower, Bitcoin almost doubled from $16,500 to $30,000 in the first half of 2023…
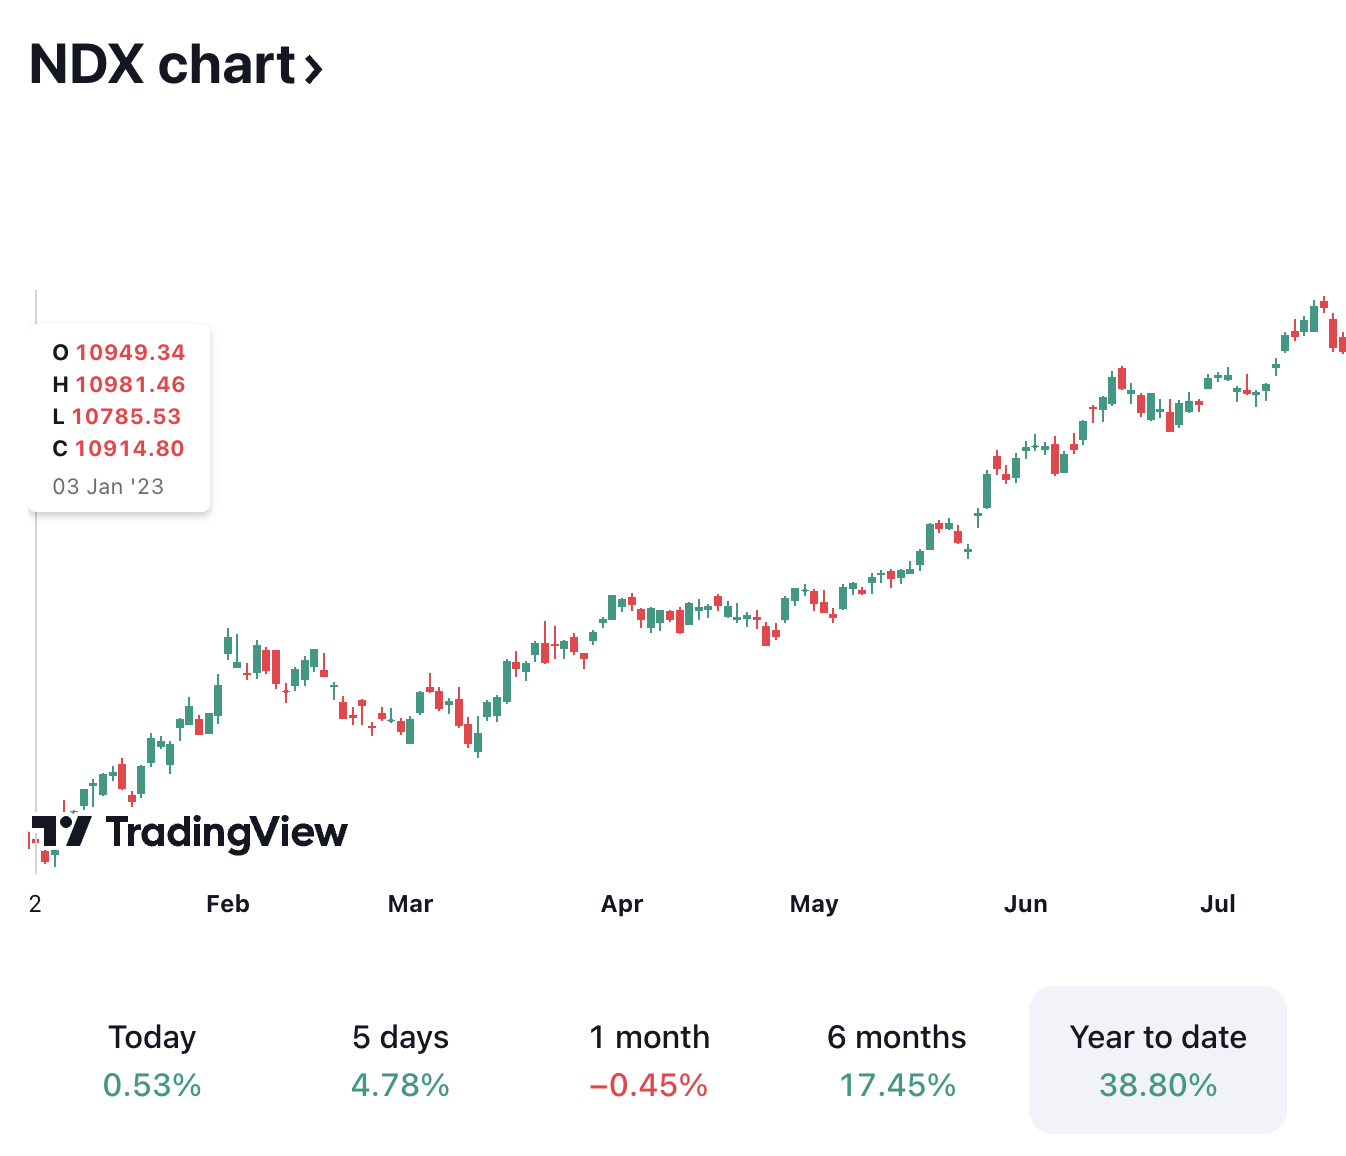
…and the NASDAQ (tech stocks) had their best start to a year in history!
Since the summer, however, markets have been quiet and especially in crypto’s case, are lower than they were halfway through the year.
We’ve once again reached a point of peak fear in sentiment; “inflation is sticky”, “interest rates will be higher for longer”, and “markets will be heading much lower”.
Yet, when I look under the hood, it appears to me that the stars are once again aligning. ✨
Forward-looking macro, TA, and sentiment are all pointing towards one thing: markets are about to make another big move to the upside.
This is your PSA to allocate if you have not done so already. The rest of this report will showcase 30+ charts on why I believe this to be true.
Of course, this doesn’t mean it’s a sure thing. Markets never are. But the probabilities are very much in our favor.
This also doesn't mean that if you buy today it will go up tomorrow. These things take time, but when they happen, they tend to happen fast (especially in crypto). 🌊
Let’s start this off with a chart to help you visualize where I think this is going (I’m going to end this report with an even better chart, so make sure you get to the bottom).
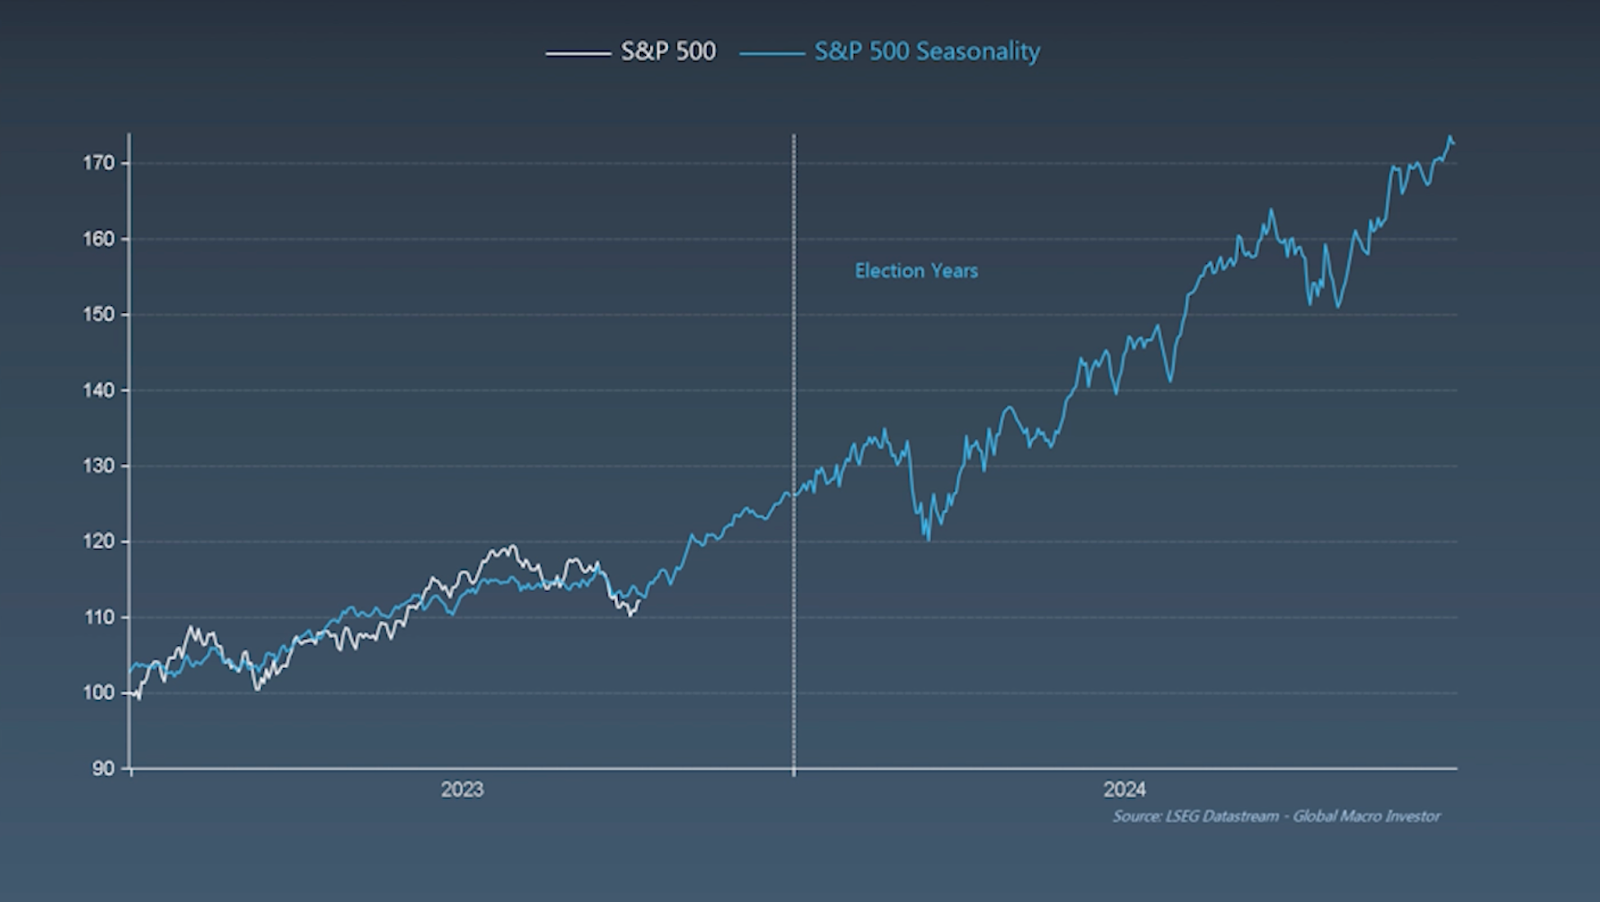
Here is a chart comparing the S&P 500 this year to the average seasonality prices of the S&P 500 since the 60s.
This year, the chart is correlating at 91%, and look at what it has in store for Q4 of 2023…
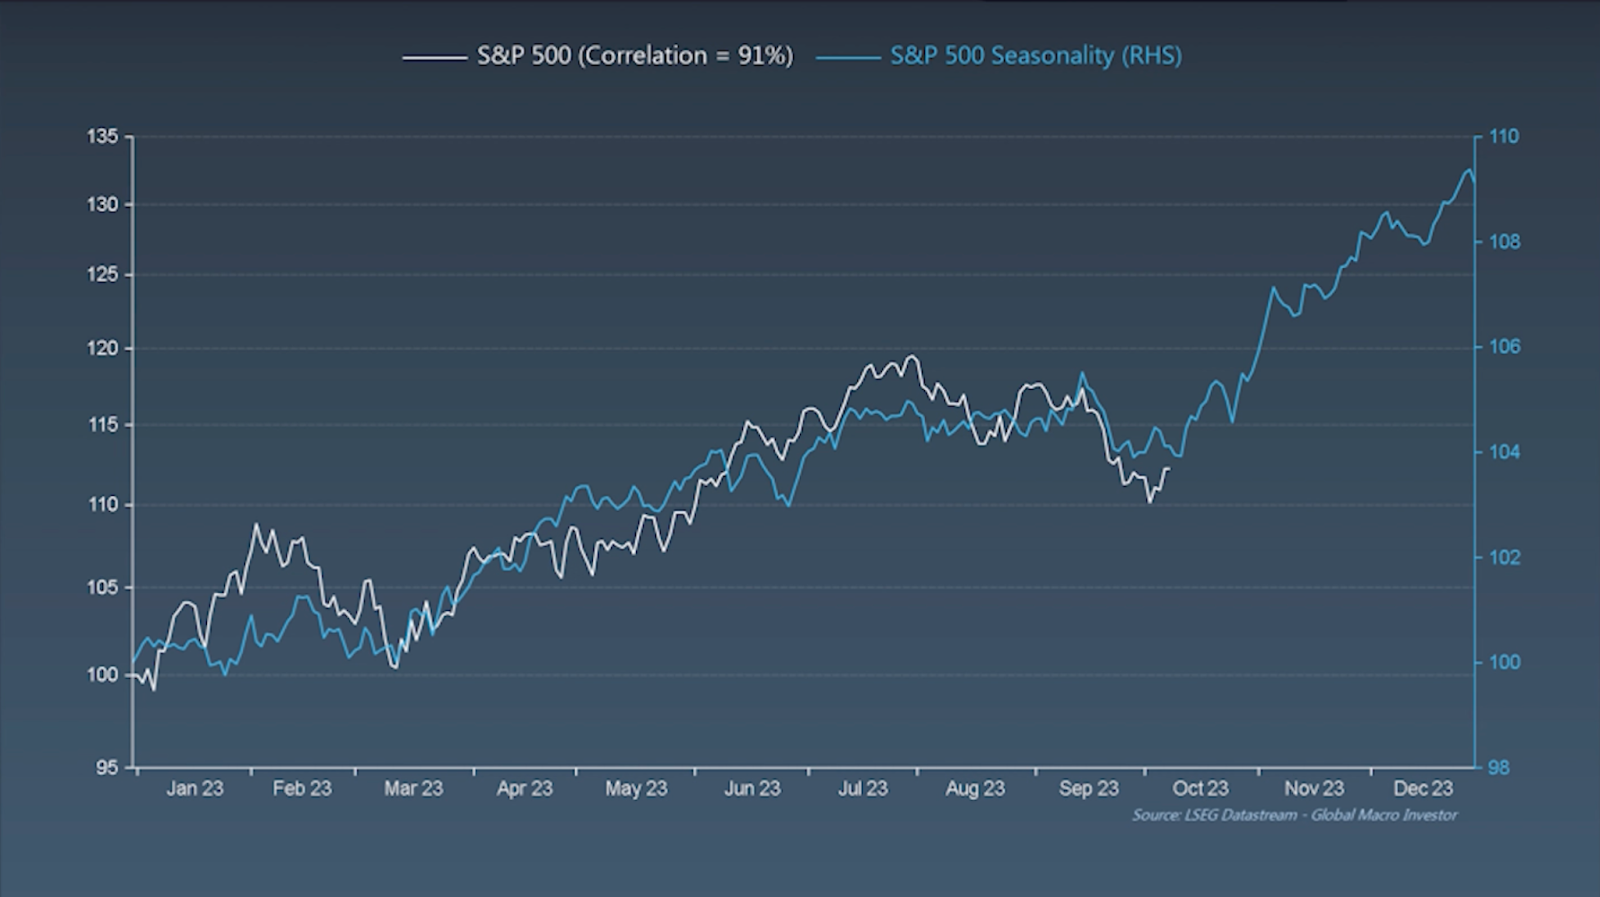
For context, The S&P 500 is up 12.5% YTD ($BTC 61.7%), and the chart above suggests that the S&P 500 will increase by 18% in Q4, which will mean even more gains for $BTC & crypto.
Now, of course, seasonality doesn’t determine where markets will go. History doesn’t always repeat, but it does often rhyme.
Let’s dive into the real specifics of why markets are about to make a move to the upside…
There are 3 areas of analysis that I’m going to discuss below:
Macro, but specifically: Inflation, Unemployment, and Liquidity
Technical Analysis
Sentiment
While this might sound like a lot and very complex topics, I'm going to keep it super simple by using charts for illustration.
This will be a walk in the park for you and well worth it in the end.
Also, for context, remember that crypto is still very much controlled by the macro environment, as are tech stocks, so let's consider the factors that influence them as being interconnected.
And finally, a quick shoutout to Global Macro Investor for most of the charts I use below. This is an institutional-grade research report that is very exclusive, and I’m lucky to have access to.
Last week, we had an inflation print with US CPI at 3.7% (the same as last month) and core CPI at 4.1% (down from 4.3% last month).
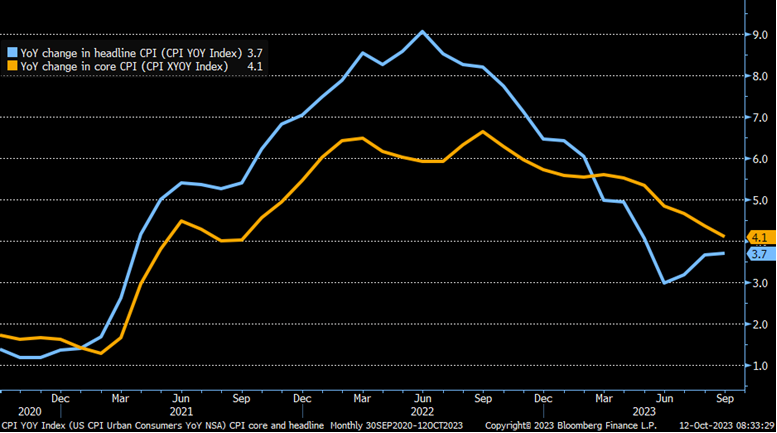
Concerns arise as the CPI hasn't decreased since June and has even increased in certain months.
However, this trend aligns with previous inflation cycles, as illustrated in the chart below.
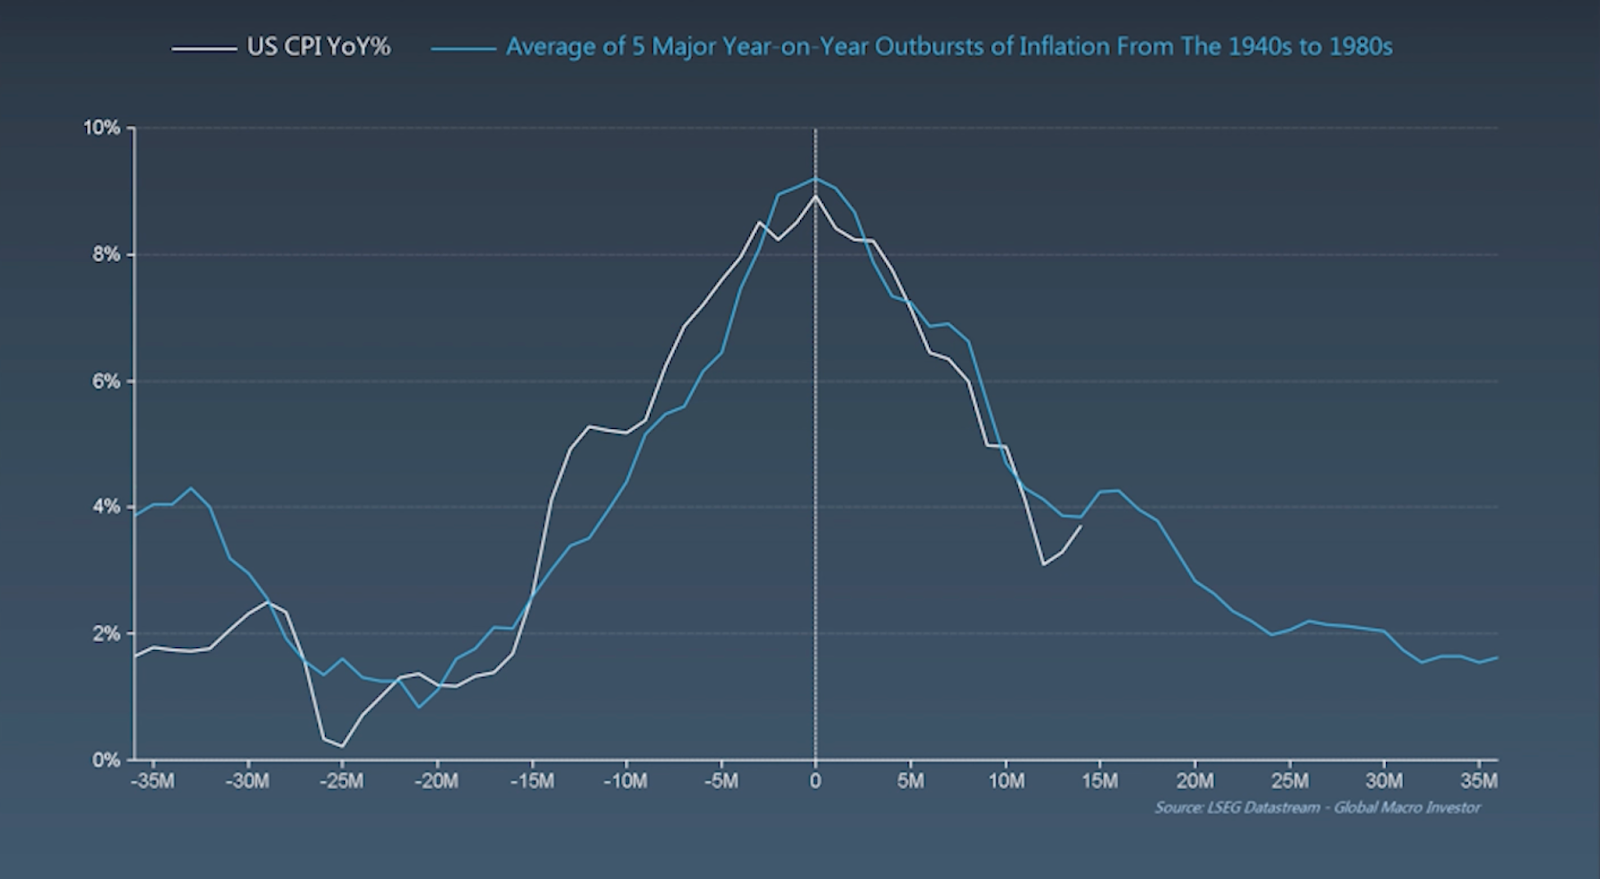
Various parts of inflation typically fall and rise like dominoes in the same order, mirroring the patterns of previous inflation cycles.
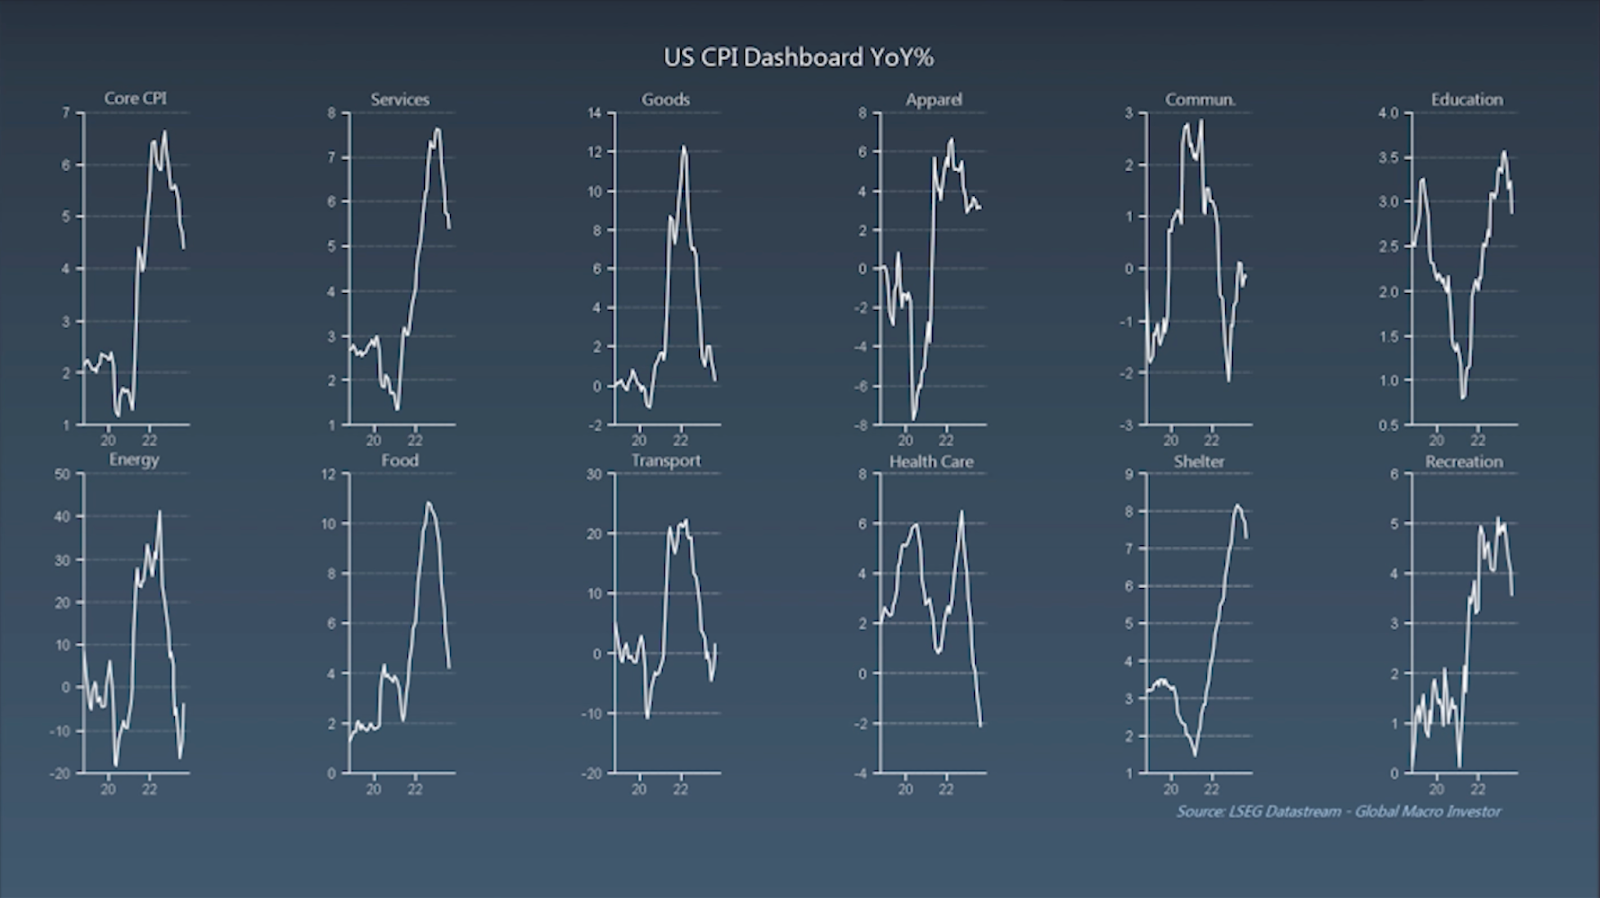
Below is a breakdown of each component of US CPI to help you visualize where each sector is at.
US CPI has gone up in the last few months specifically because commodity prices have risen. In fact, leading indicators show they will likely continue to rise, as they always do at this point in the business cycle.
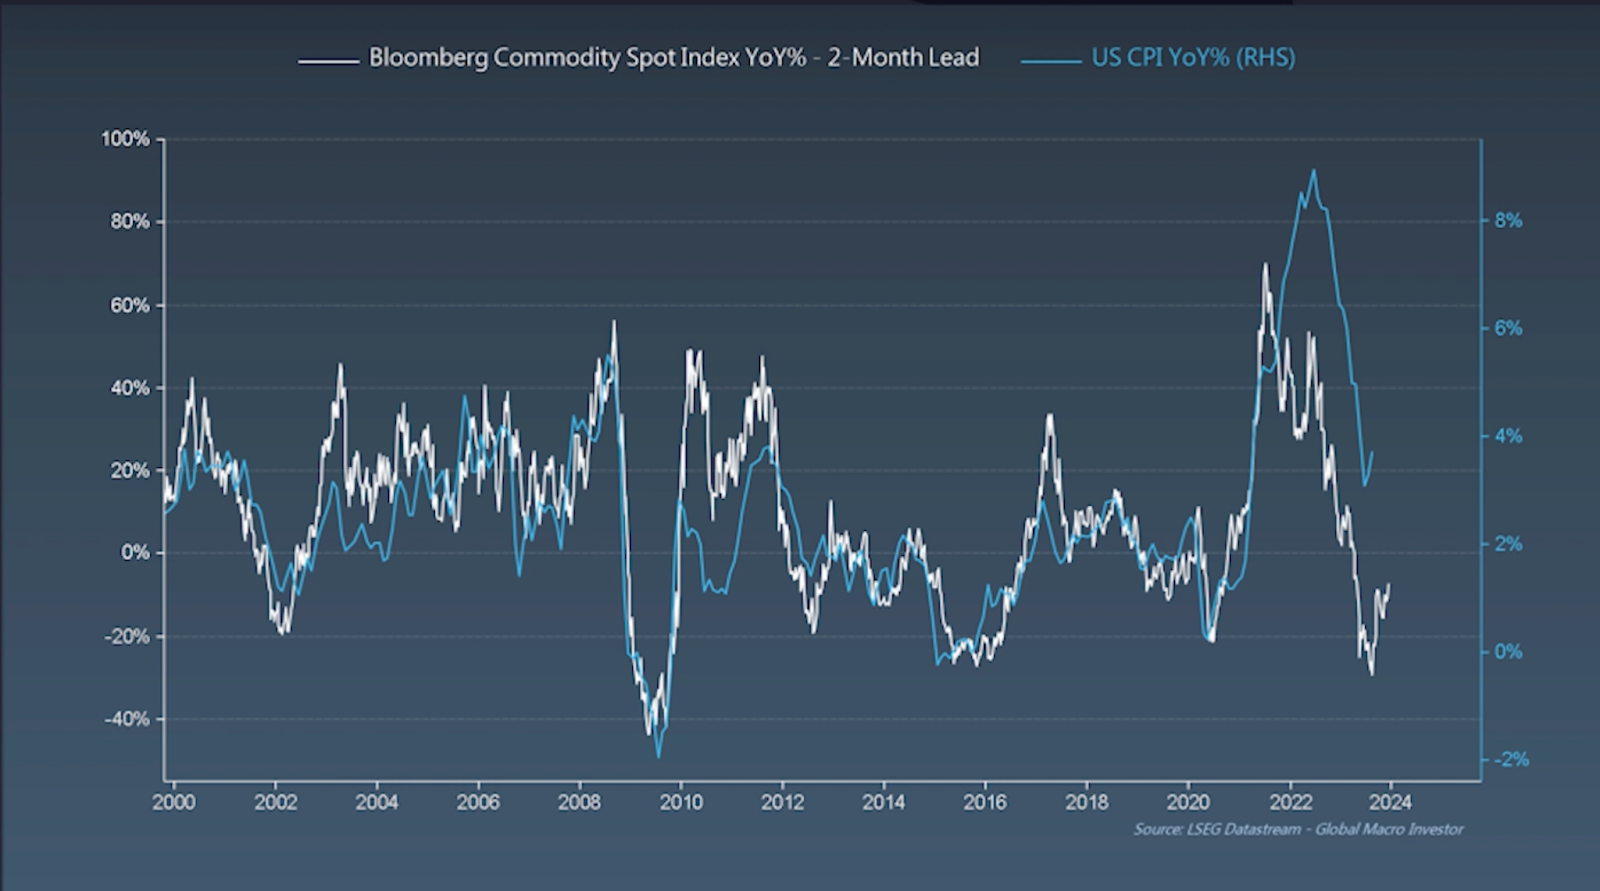
However, commodities only make up about 15% of US CPI, whereas food, shelter, and energy make up close to 75% of US CPI.
As you can see above, while commodity prices shot up in the last few months, shelter and food are rolling over and even picking up steam.
Let’s take a look at what forward-looking indicators show for food and shelter.
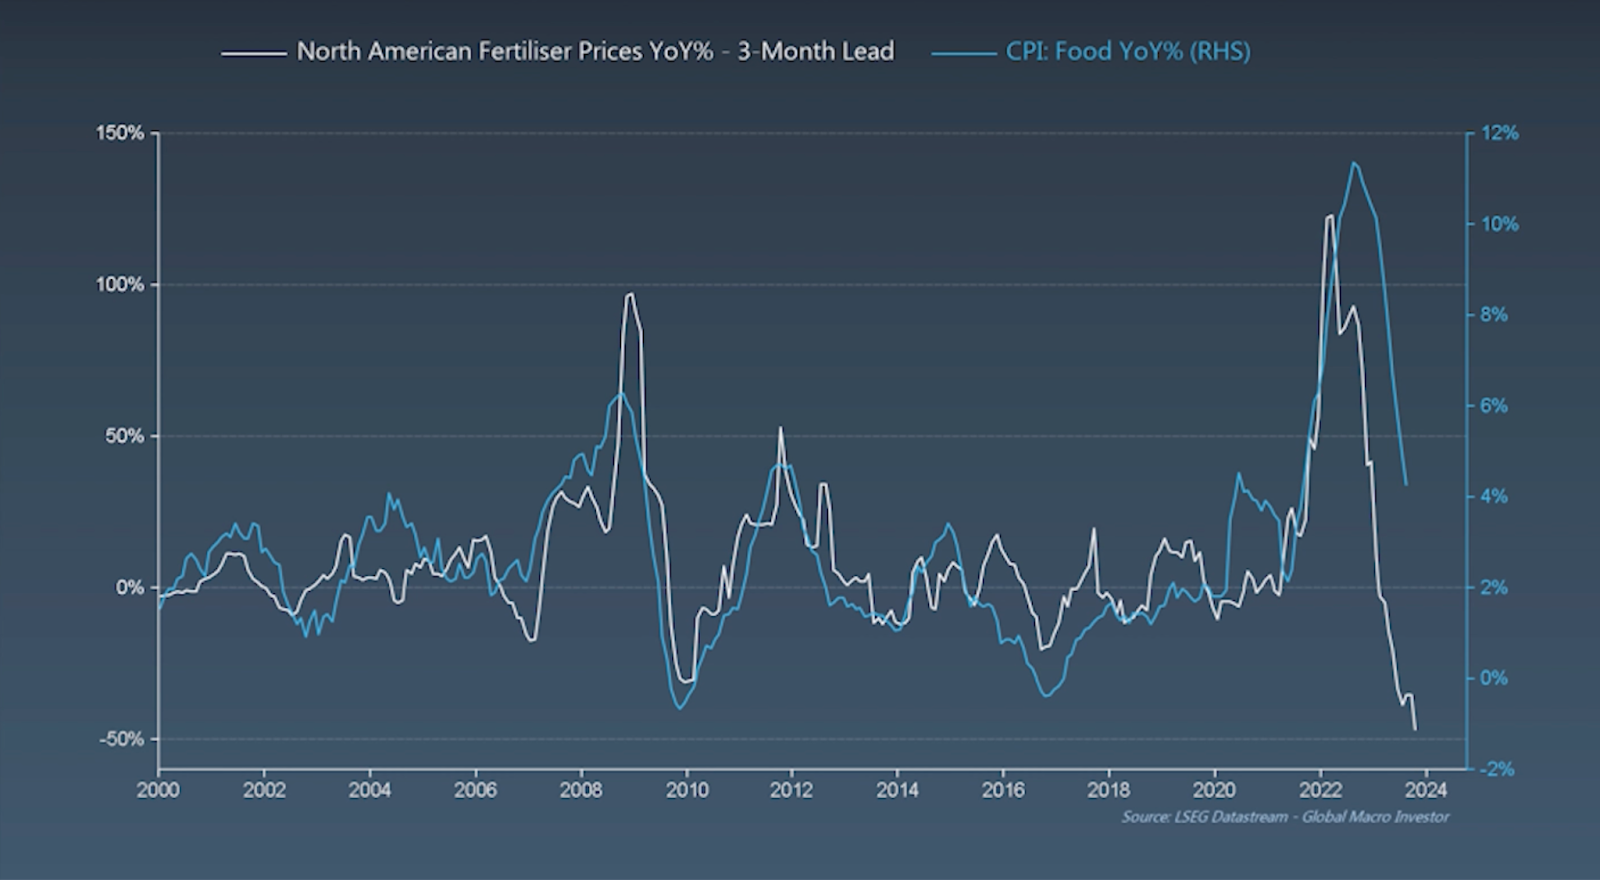
Food makes up 13% of US CPI, and fertilizer prices are one of the best leading indicators for food prices.
As you can see in the chart below, the price of fertilizers has been falling off a cliff and is showing it will actually go below 0% by the end of the year.
Based on that, food inflation is likely to continue to fall drastically over the next few months, as it has already in the second half of this year.
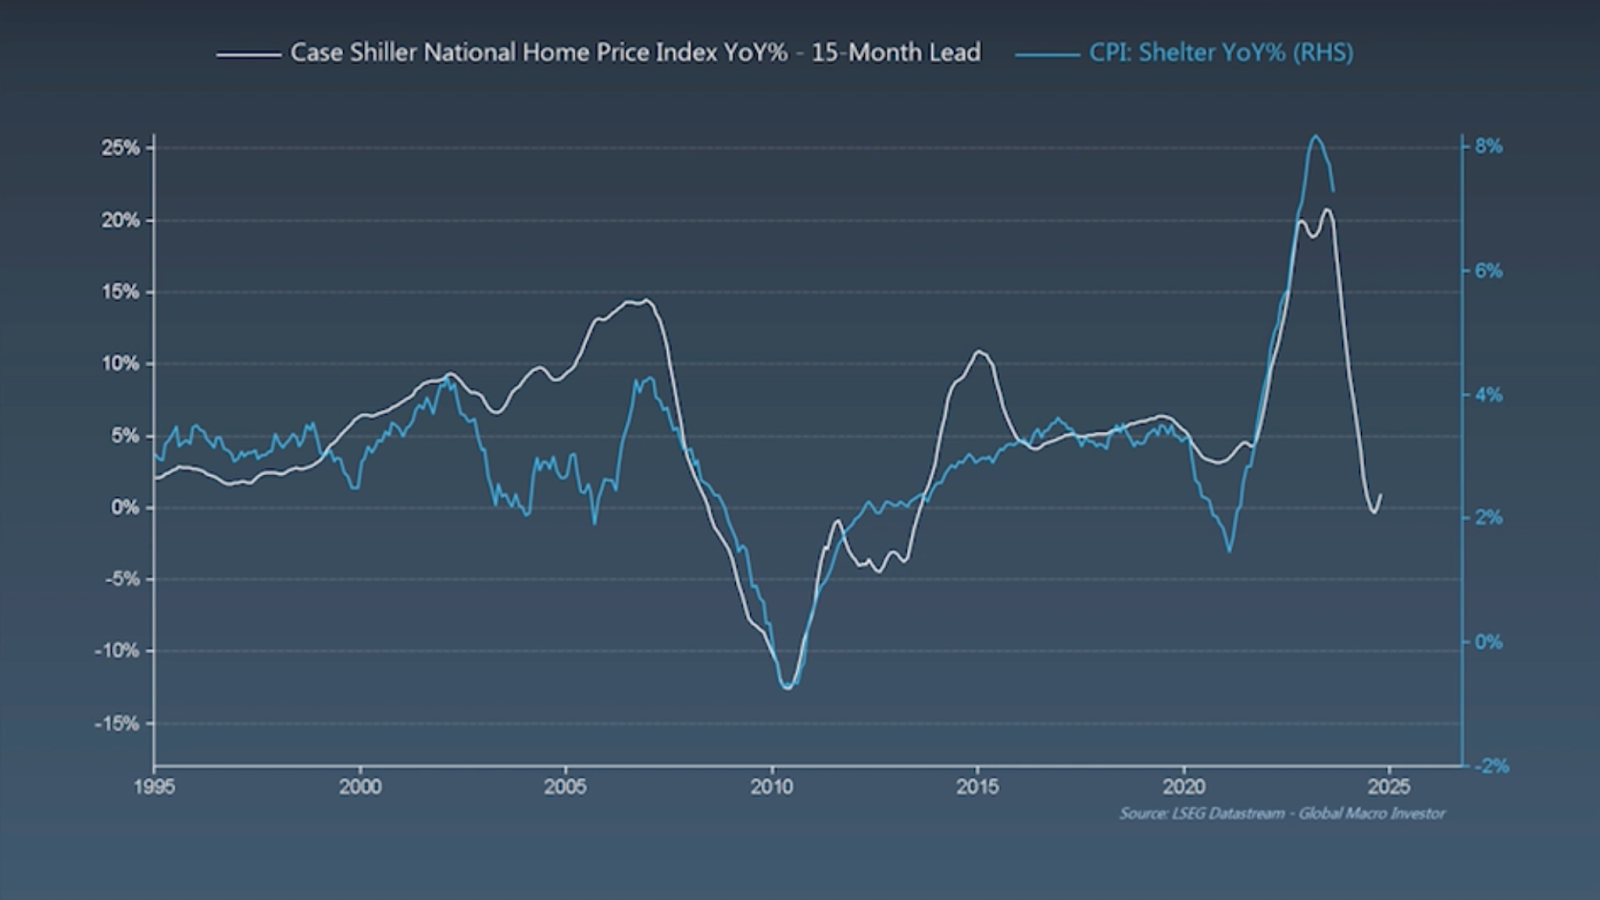
Shelter, which makes up 35% of US CPI, is just starting to roll over and should collapse significantly over the next year. This will be the biggest driver of lower inflation.
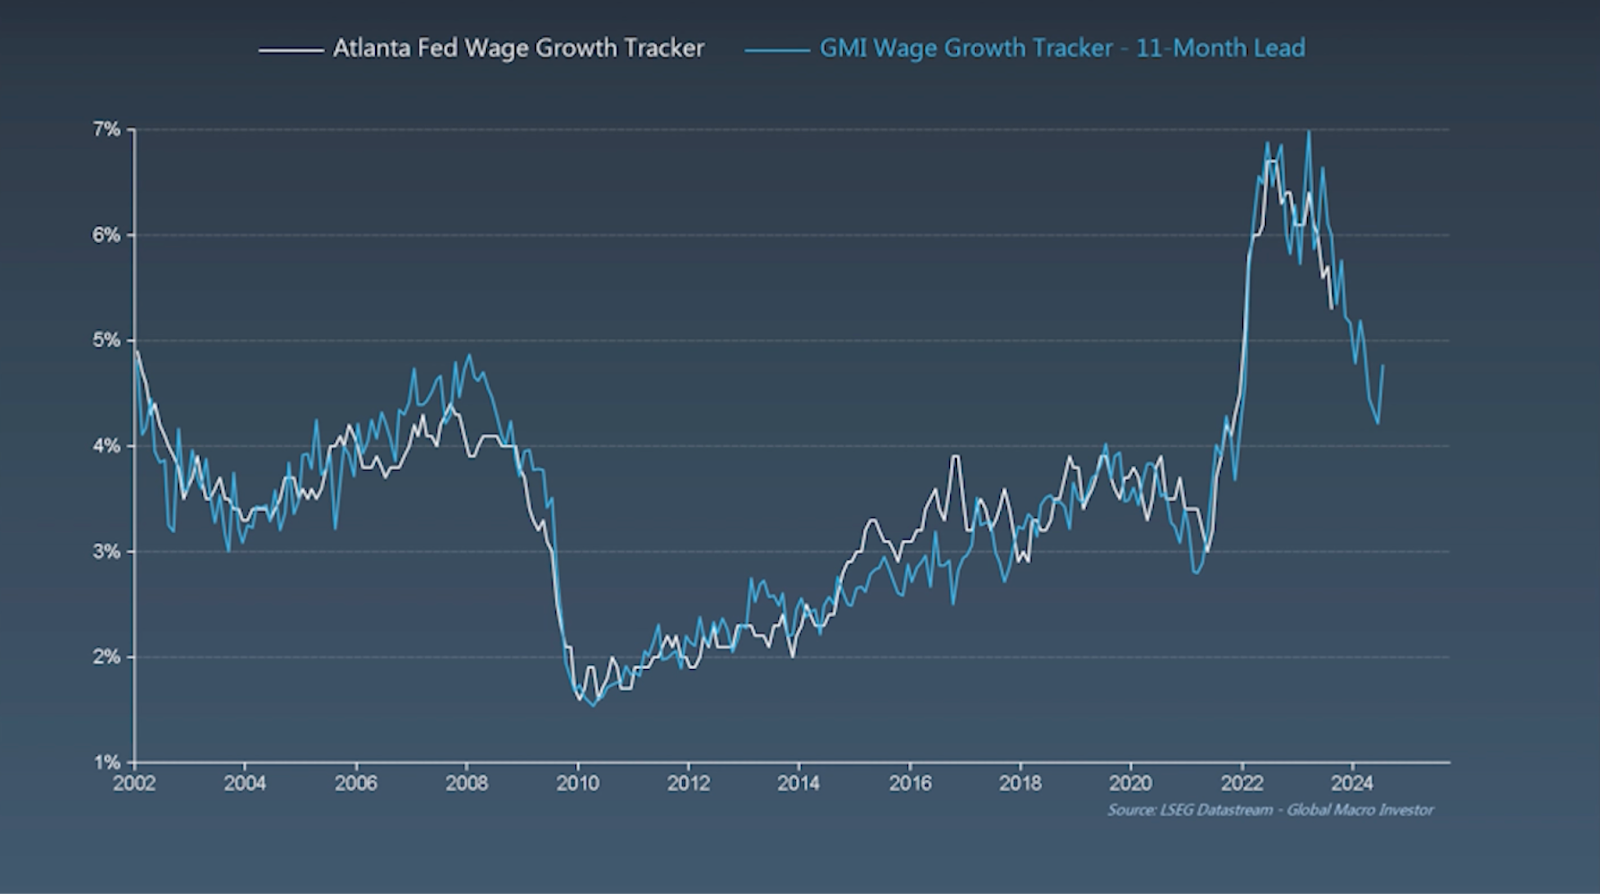
I’ll touch on energy later in the TA section, but one last note on the CPI side of things is that wage growth also really matters here.
Generally, if wages rise, it’s more difficult to bring inflation down.
However, wage growth is in a downtrend and should continue to be into next year, according to leading indicators.
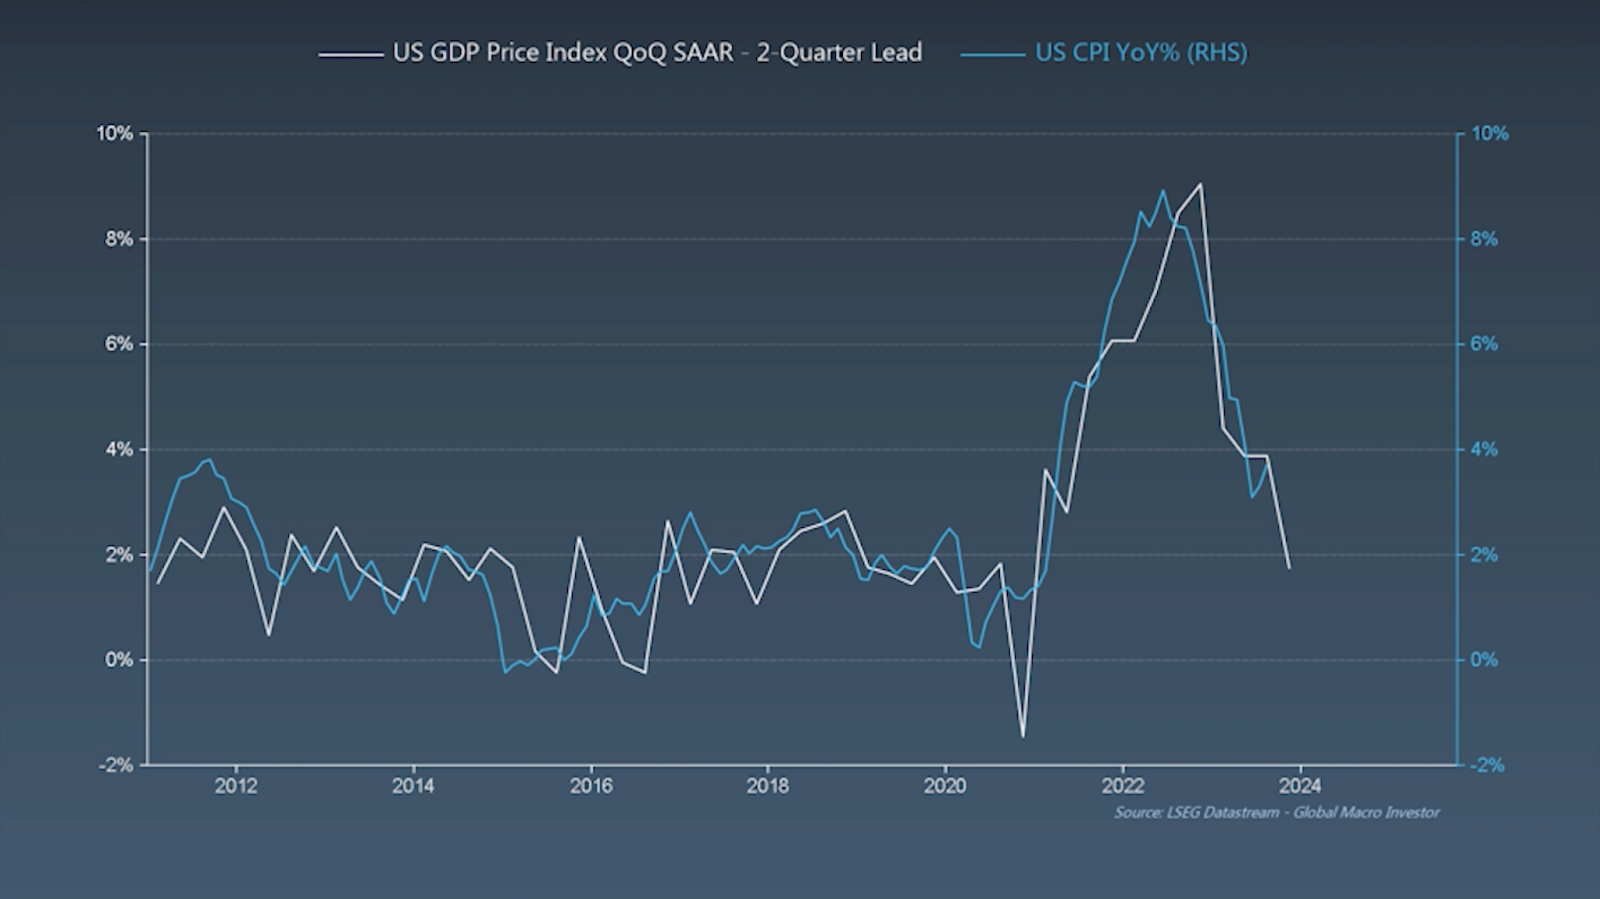
One thing that is important to understand is that the business cycle leads to inflation (not the other way around), so if you can understand where the business cycle is going, generally, you can see where inflation is going.
This chart looks at the US GDP 2 quarters ahead, which also shows inflation to be down near 2% by the end of the year.
In fact, if you simply remove the parts of US CPI that always lag (shelter, food, and energy) then inflation is already sitting at 2.3% and predicted to go near 0 in just a few months from now!
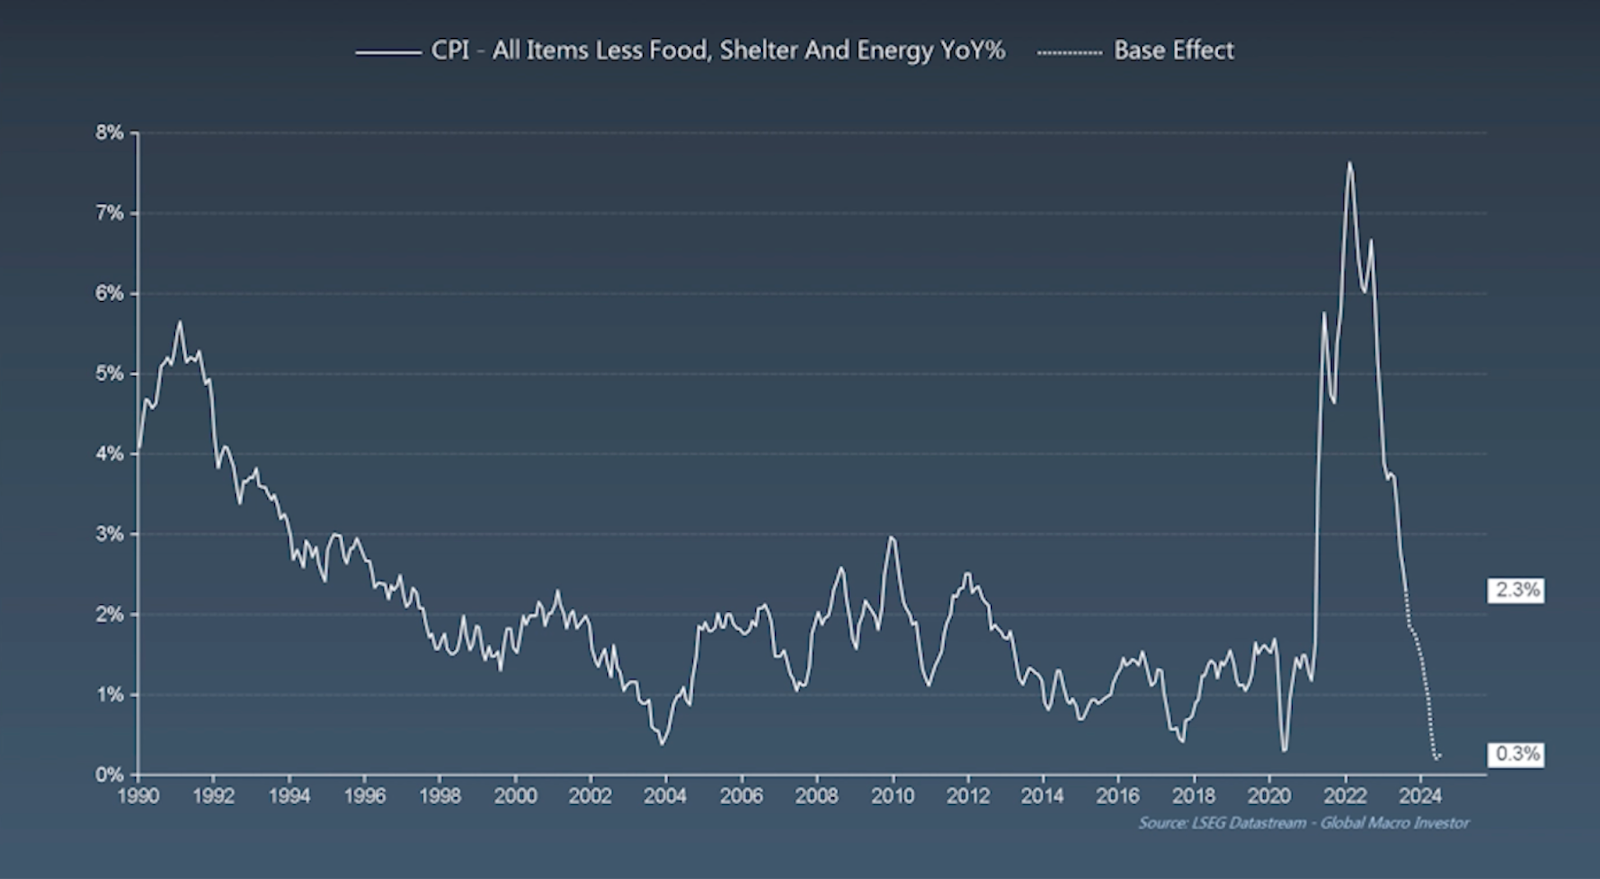
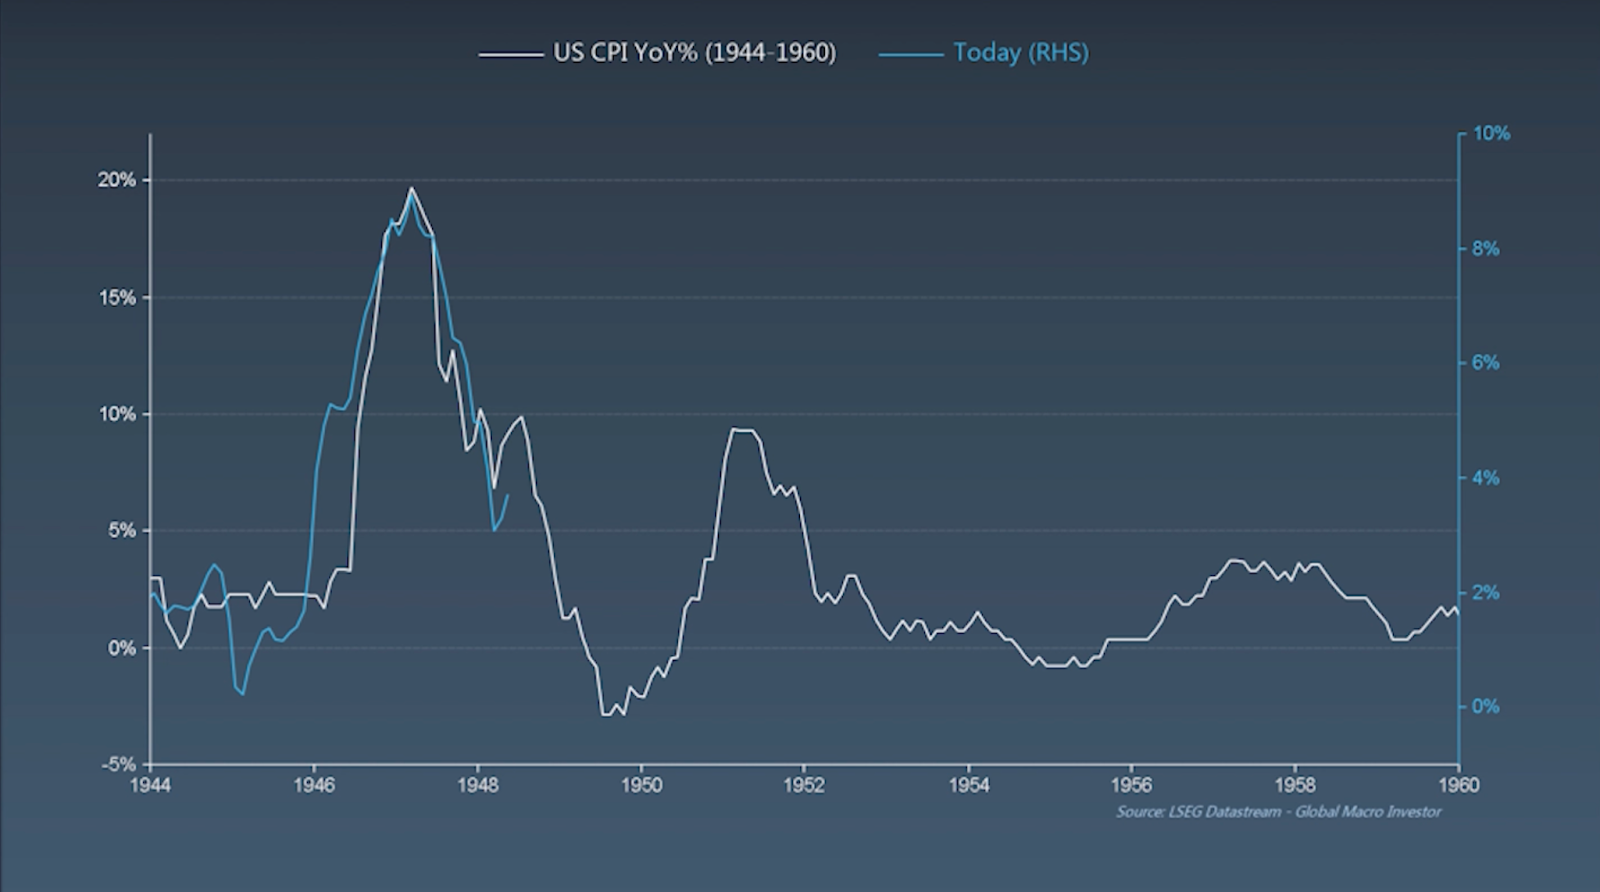
I showed this chart before, but the most likely scenario is that inflation undershoots (potentially going negative) and then bounces back quickly before settling in the <2% range that the FED is aiming for, similar to how it did post WW2.
Now why is inflation SO Important? Let’s look at what happens when CPI starts to cool off.
Brazil, one of the first countries to raise rates when COVID started, has seen their core CPI fall significantly in 2022 (a bit ahead of the US), and as a result, they have begun cutting interest rates already.
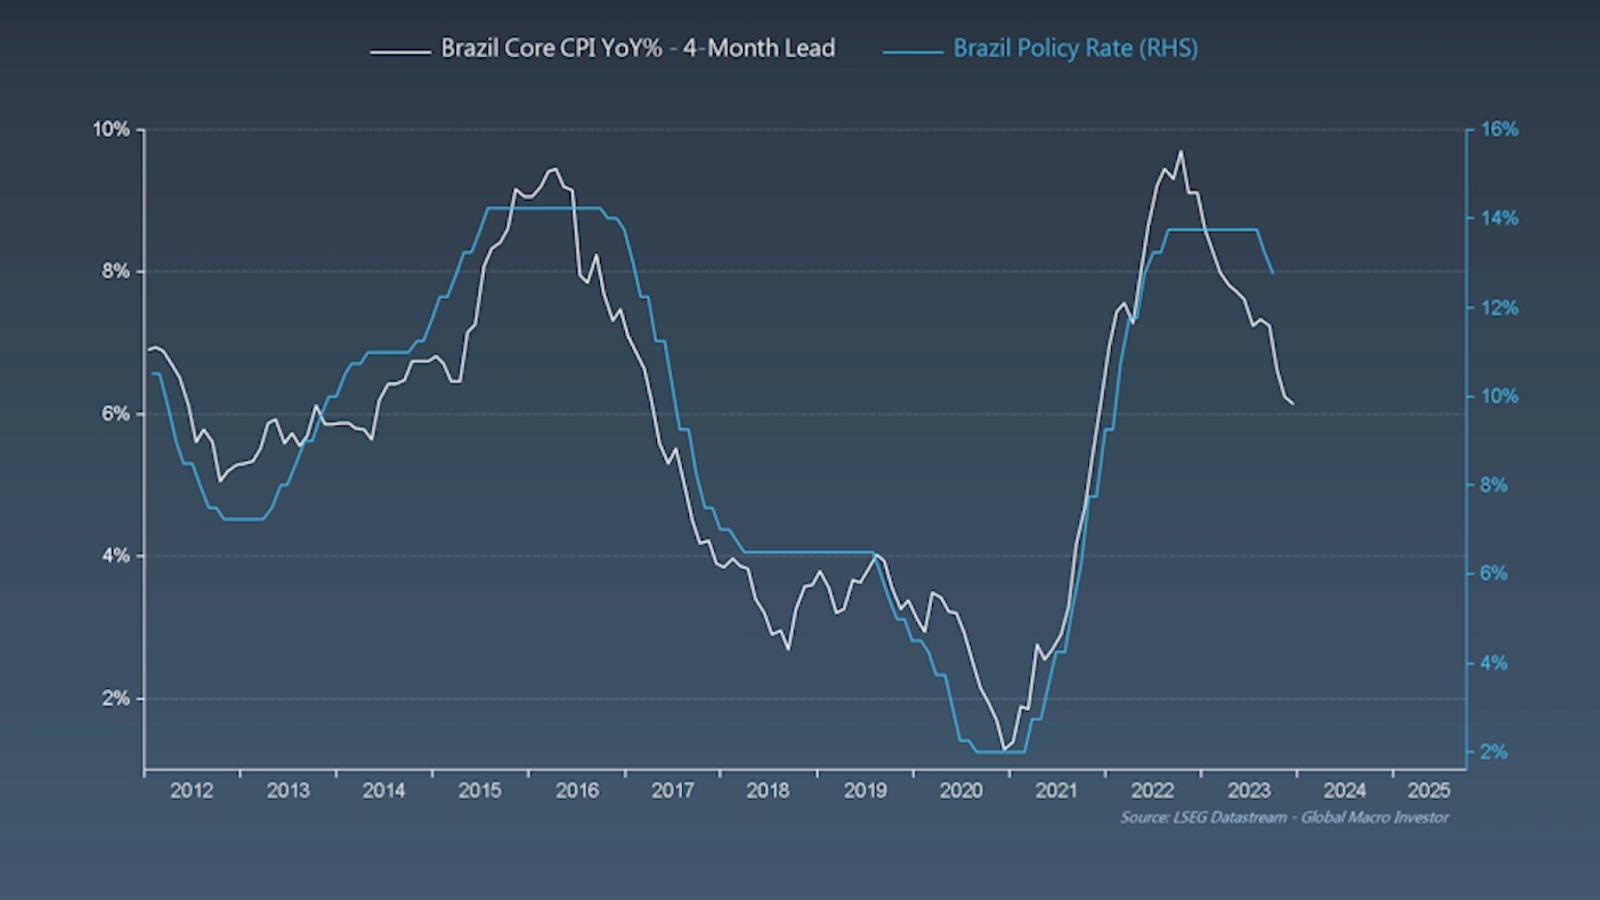
The same scenario is likely to play out in the US. However, unemployment is an important factor at play for interest rates too, so let’s move from inflation to unemployment.
Unemployment is a bit of a tricky data point, specifically recently as there have been revisions in how they calculate it and various other factors related to COVID.
The consensus at the moment is that employment is remaining sticky, and since unemployment has not risen high enough, the FED can not cut rates, as this would bring inflation back.
The most recent unemployment numbers were 3.8%, which remains flat from last month, however, if we look at year-over-year terms, it’s rising sharply.
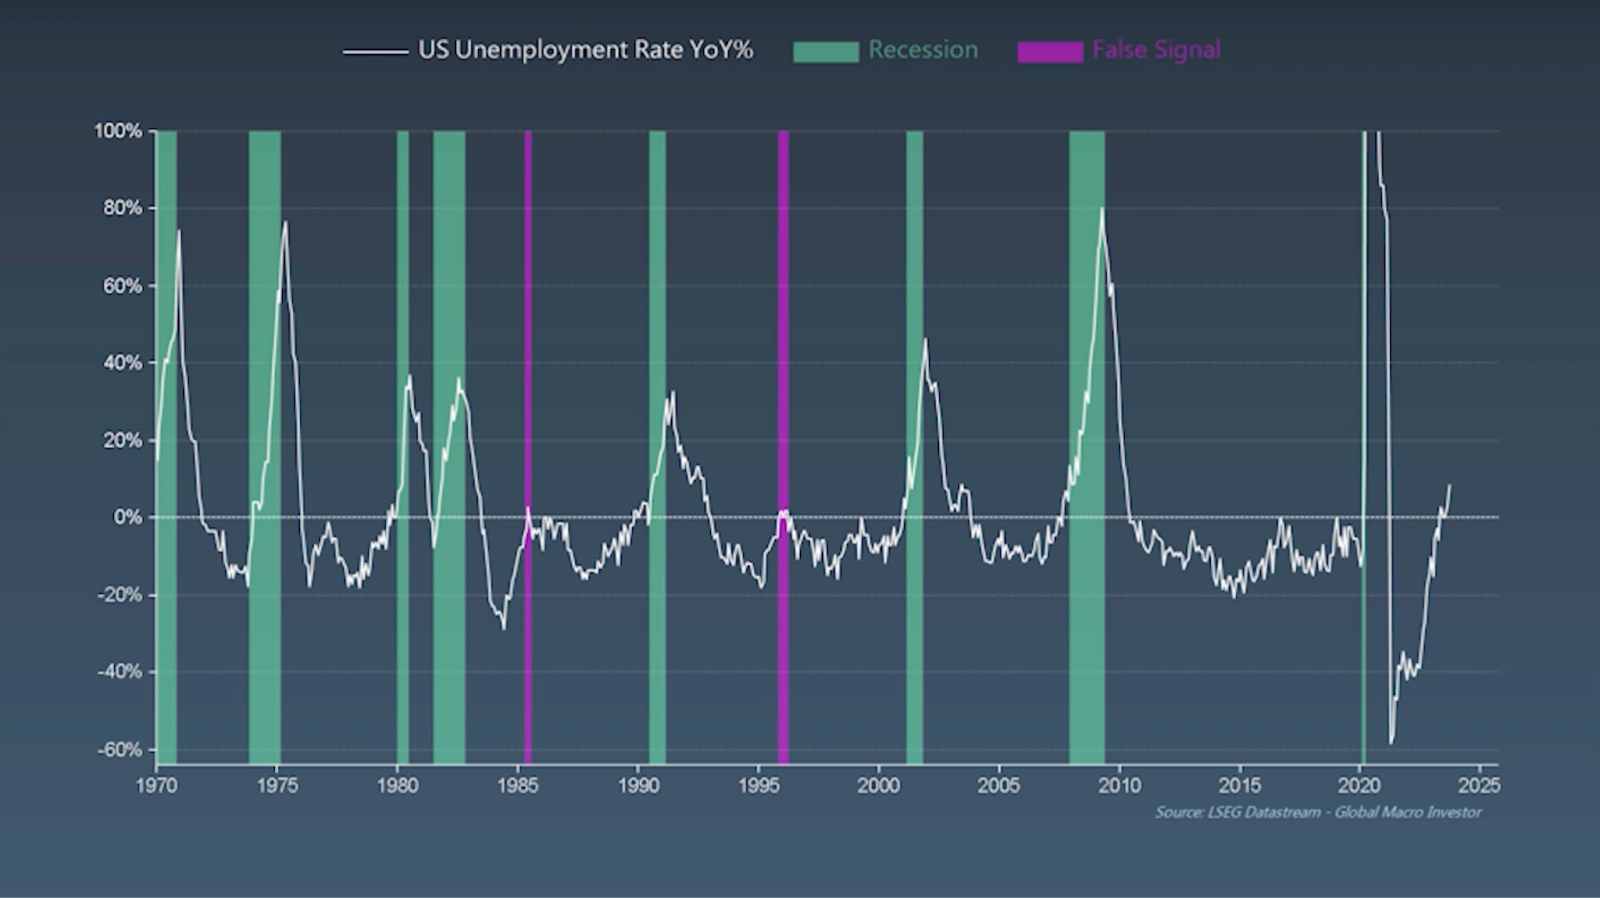
Only twice in history, when the unemployment rate rose over 0% in year-over-year (YOY) terms, have we not had a recession (Recession = Inflation & interest rates ).
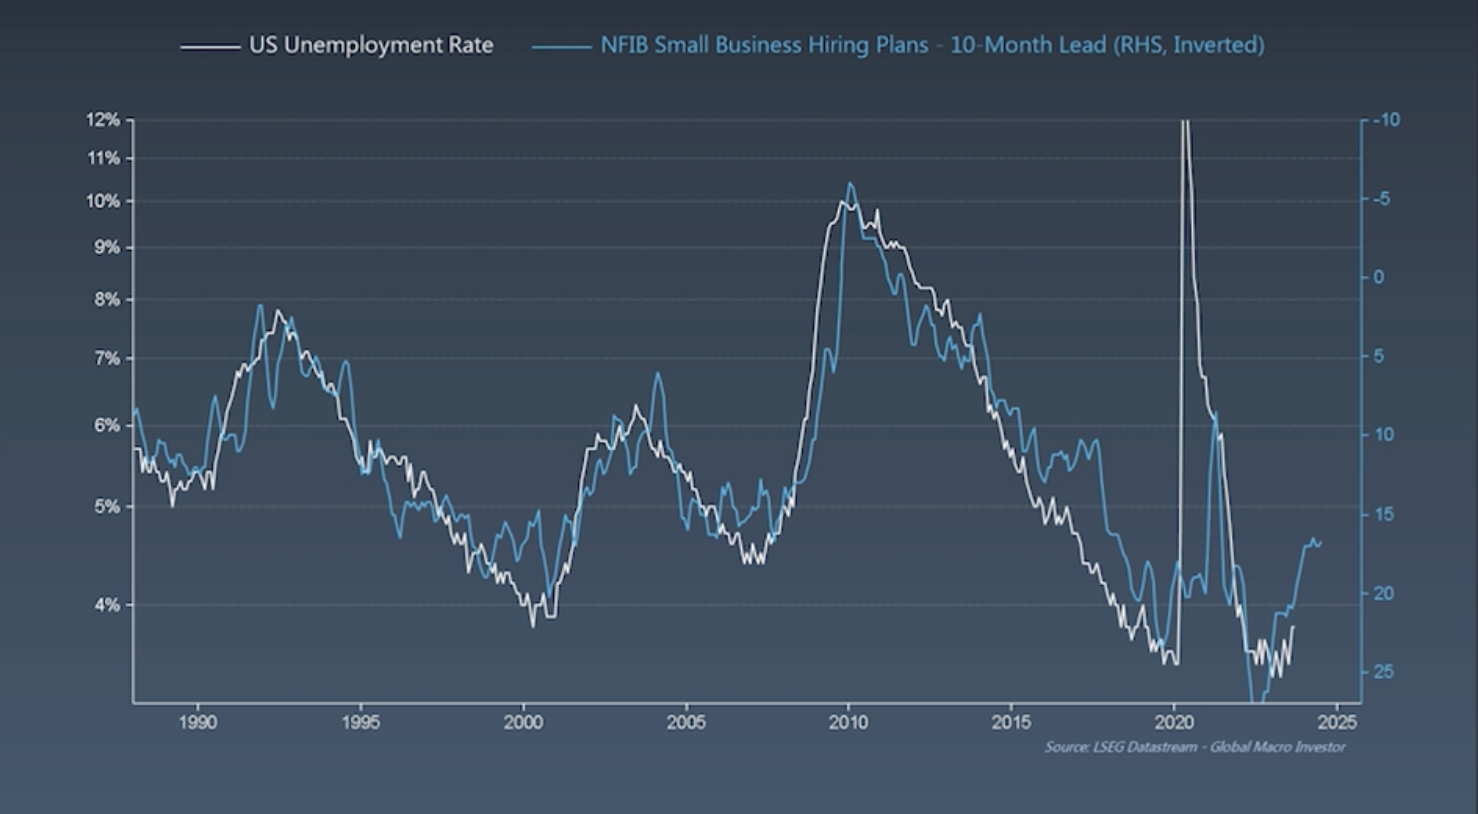
And if we look at long-term indicators, like the small business hiring plans, we can see that unemployment is likely to continue to rise from here, at least another 1-2%.
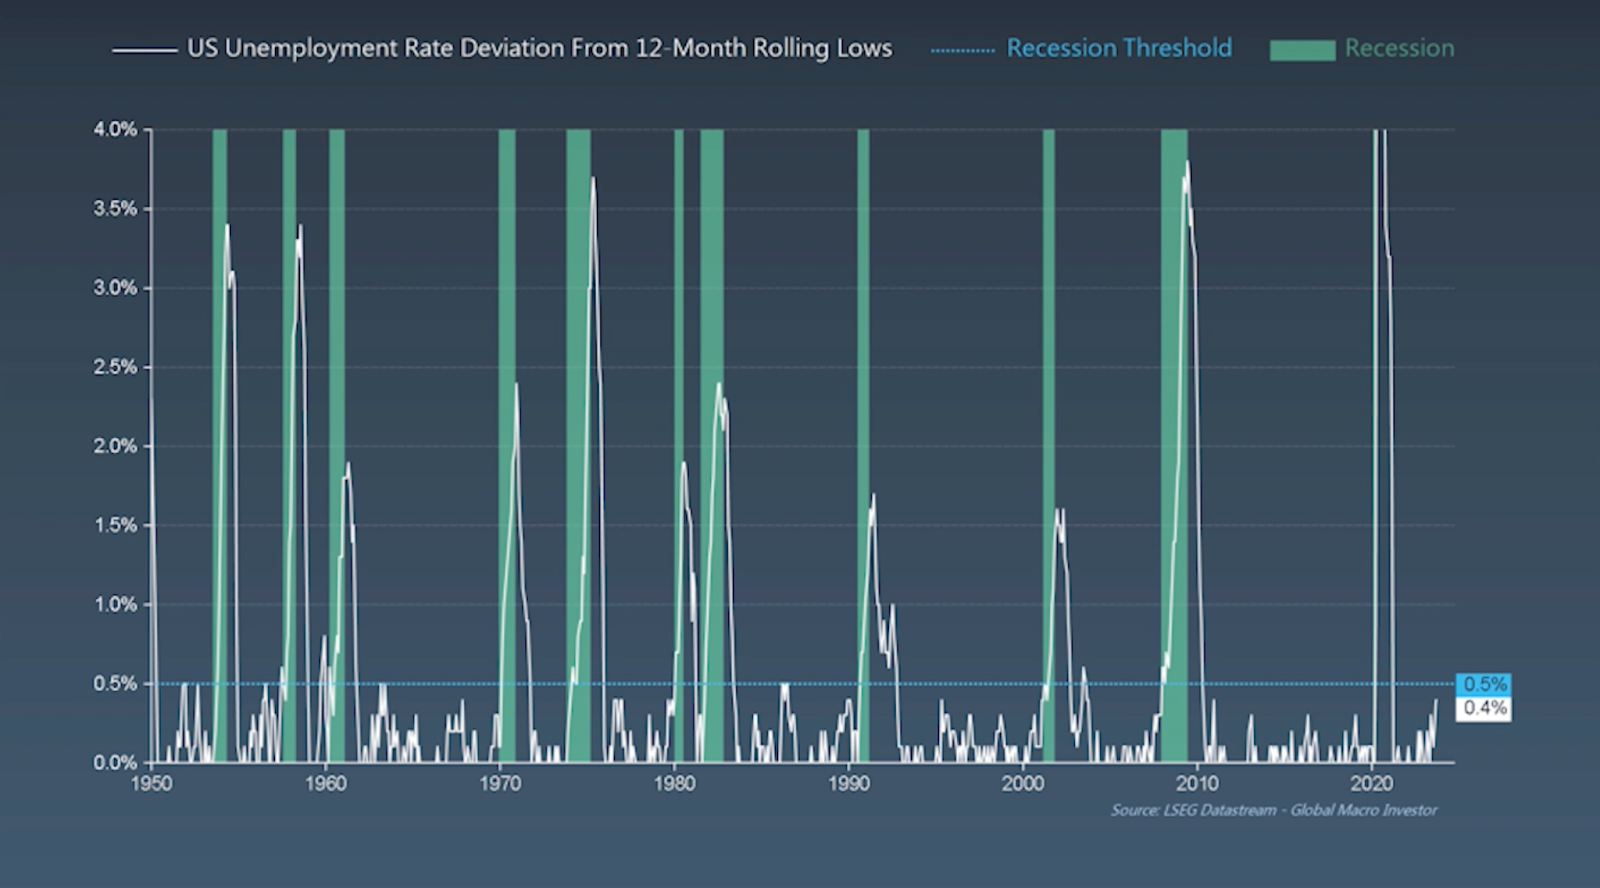
Interestingly, any time unemployment rises by 0.5% from the lows, we reach a recession. As we can see below, we’re currently at .4%, so we don’t have far to go.
And whenever the US unemployment reaches .5% off the lows, look what happens to interest rates…
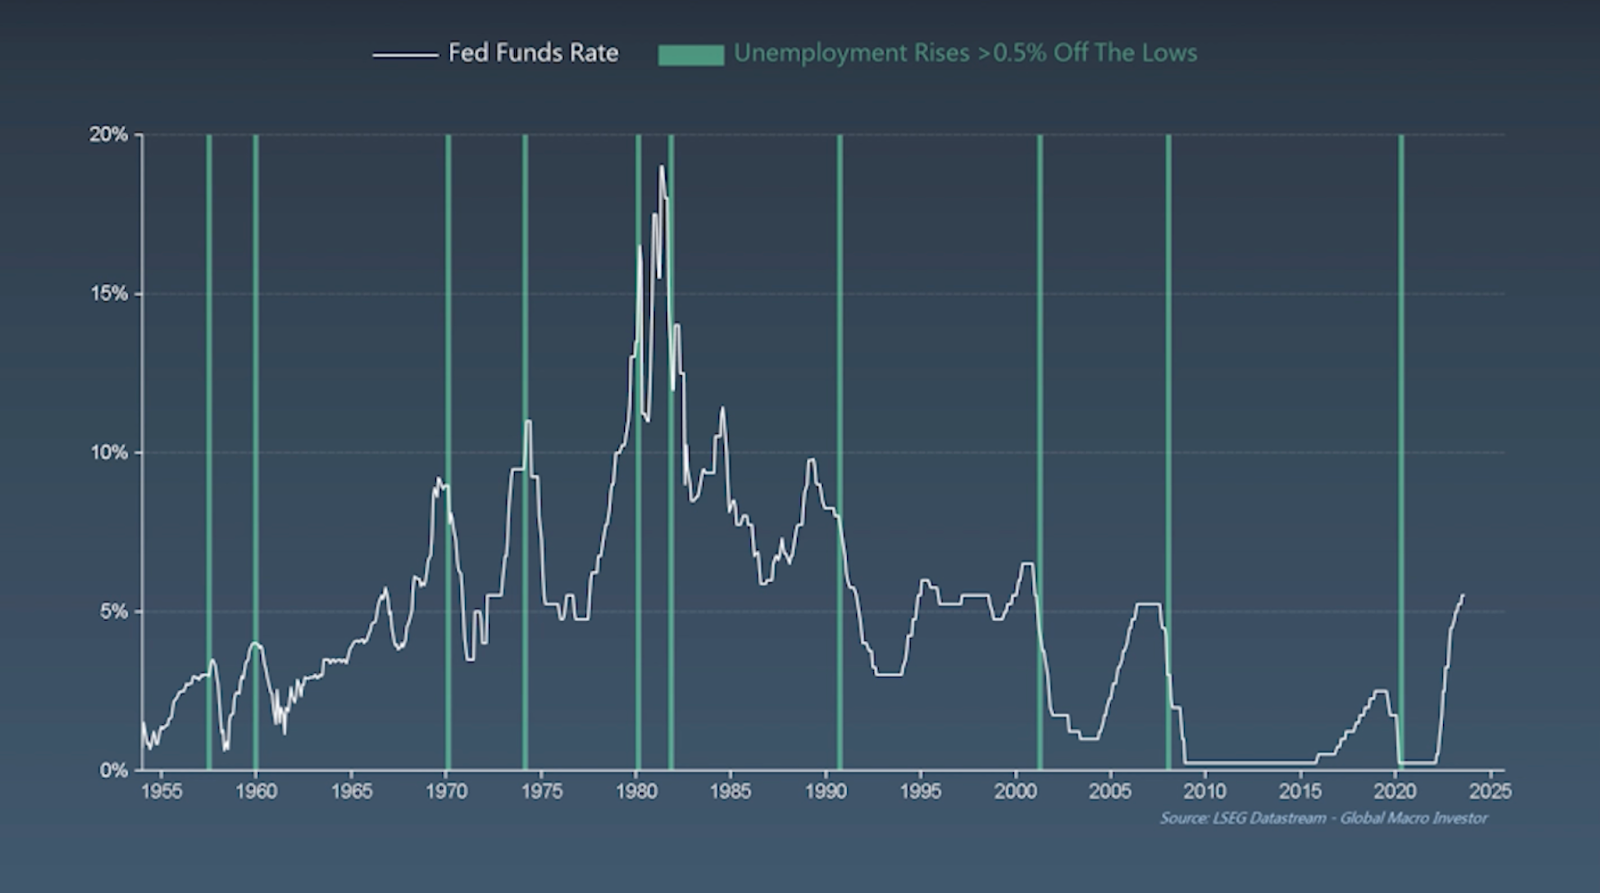
Every single time since the 1950s, the FED has cut interest rates at that exact point! Why would this time be any different?
So, we have inflation heading lower and unemployment heading higher, which very likely means that interest rates will be heading lower.
At the same time, change in global liquidity YOY is climbing and just a few months away from pushing positive.
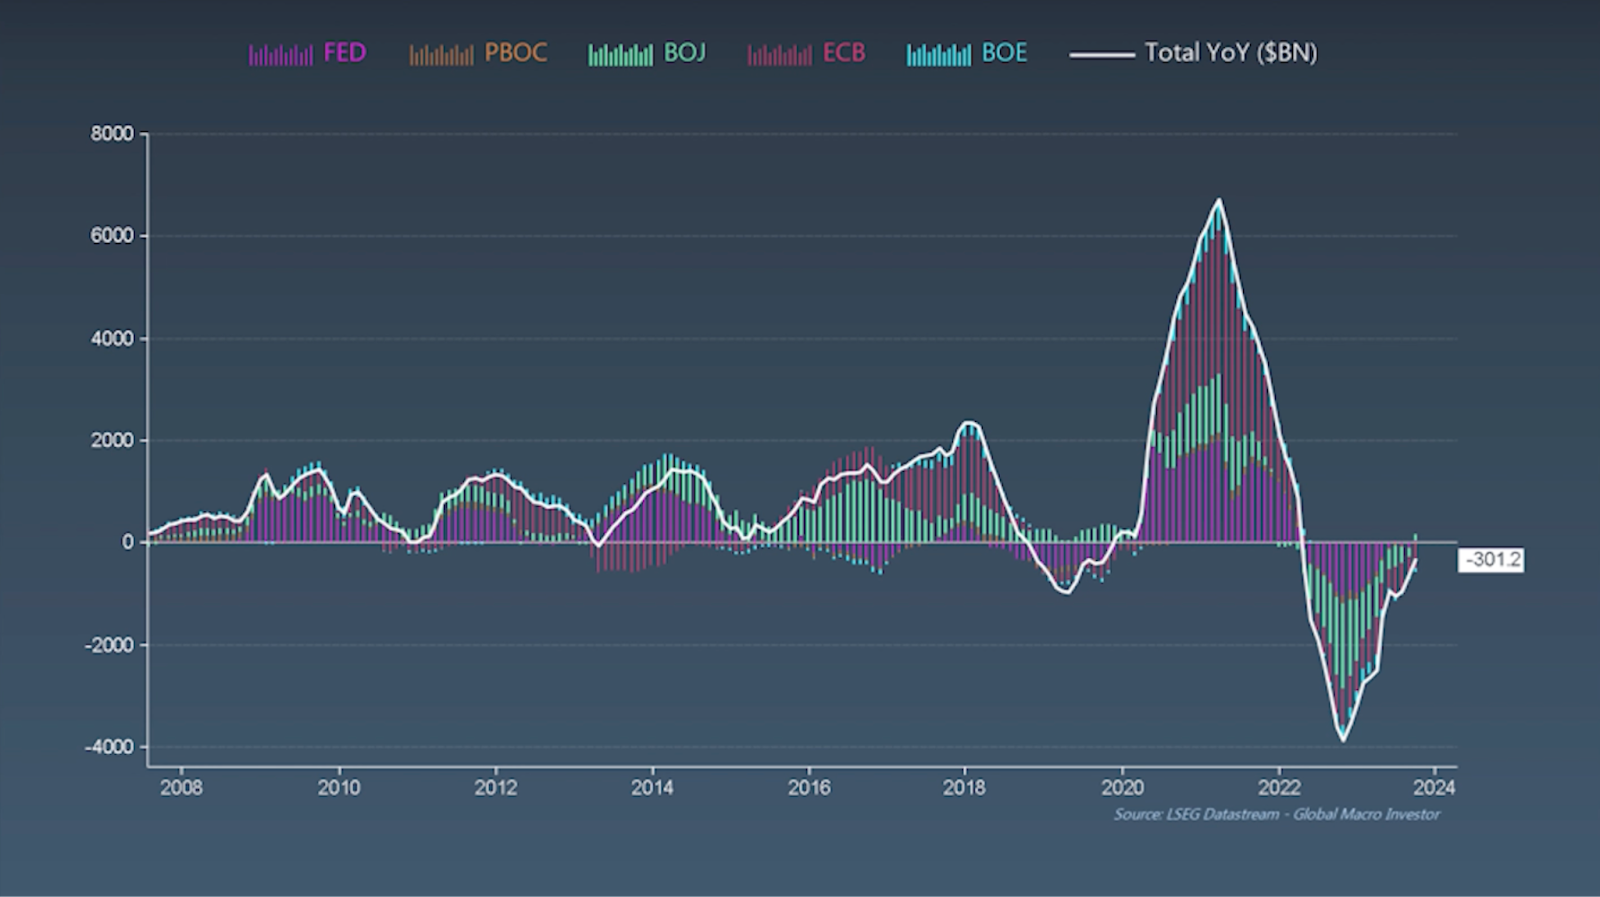
FYI: the chart above is showing that global liquidity is still negative but the rate of change is lessening to the point that it will soon flip positive.
Here’s another chart to look at the liquidity cycles over the last 30 years and where things are likely to go over the next 7 months. 👀
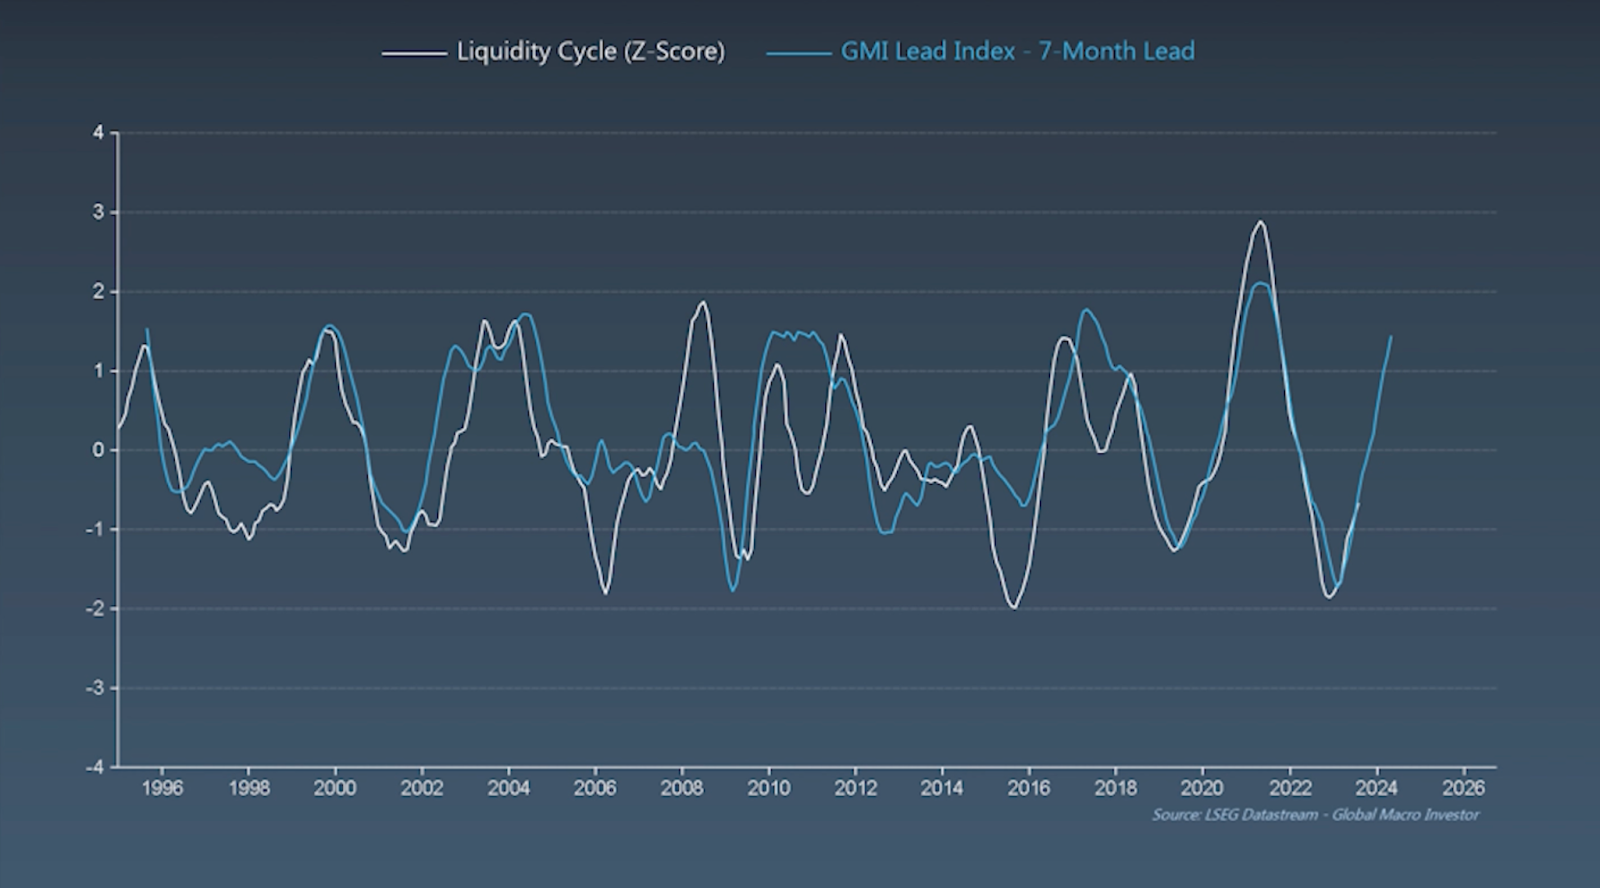
The turn in the cycle of inflation, liquidity, and unemployment all lined up around the end of 2022, which is why it appeared that markets would make a strong move to the upside.
This time, each of these sectors are lining up once again to allow the FED to lower interest rates and global liquidity to shoot much higher, driving asset prices with it.
Even if the FED doesn’t lower rates this year (which I don’t think they will), the numbers are in place for them to do so in the near future.
Markets will understand this and when the numbers suggested by the leading indicators above are realized, that will be the signals the markets need to flip bullish.
By understanding where these numbers are heading, we can get ahead of the curve and allocate before everyone else does.
While macro is lining up nicely for us, let’s take a look at market structure through Technical Analysis and Sentiment to back up our timing.
When prices struggle for a few months, people tend to lose track of where things are.
So let’s start with the crypto cycle chart, so we can all remember where we are and what’s likely ahead of us if these cycles continue to play out as they do.

Cool, now let’s level up.
Because this report is showing institutional-grade research, we’re going to do the same with Technical Analysis (bare with me here).
Some of the best investors in the world use a type of TA called ‘Demark Indicators’ to help guide when they allocate and remove capital from markets. It’s not a perfect science by any means, however, its accuracy in predicting short to medium-term changes in market trends is pretty good.
Disclaimer: I have no idea how to use Demark Indicators, however I do subscribe to some experts who do. So below, I’m going to briefly share some indicators which were shared with me.
I’m not going to explain to you how it works, but in layman's terms: 13’s and 9’s mean good accuracy, and 13’s and 13’s are really good accuracy.
Here is a chart showing it predicting the movement in bonds the last few months (when you scale out, you can see it doing so with solid accuracy for years).
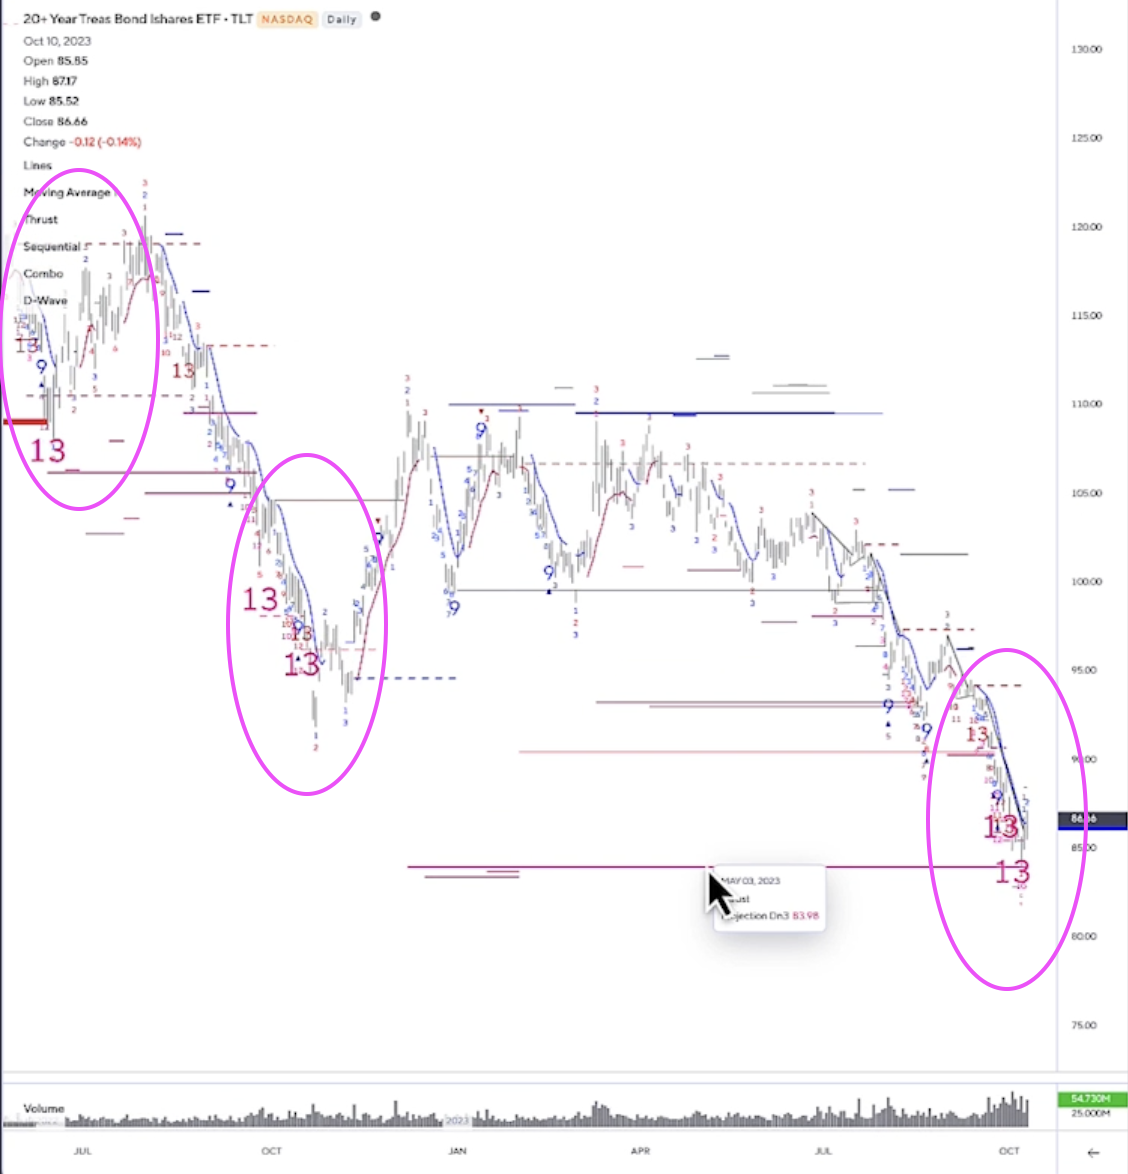
By the way, bonds changing direction is a very bullish thing for risk assets like crypto and tech stocks.
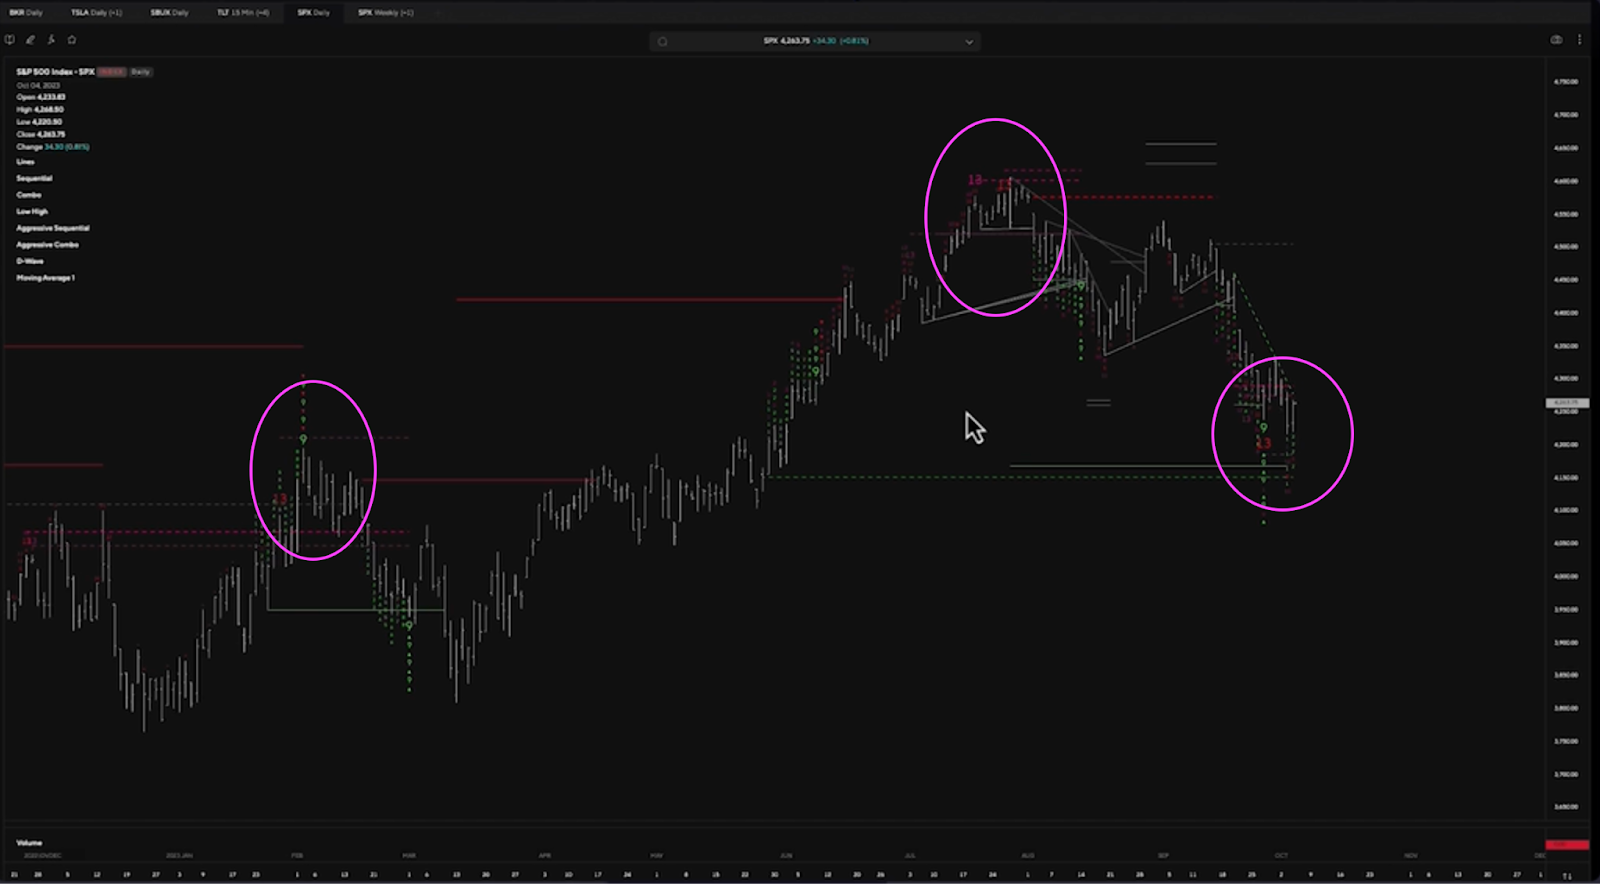
If we look at the S&P 500, it’s called the last two big tops in 2022-2023 and is currently calling for a reversal to the upside.
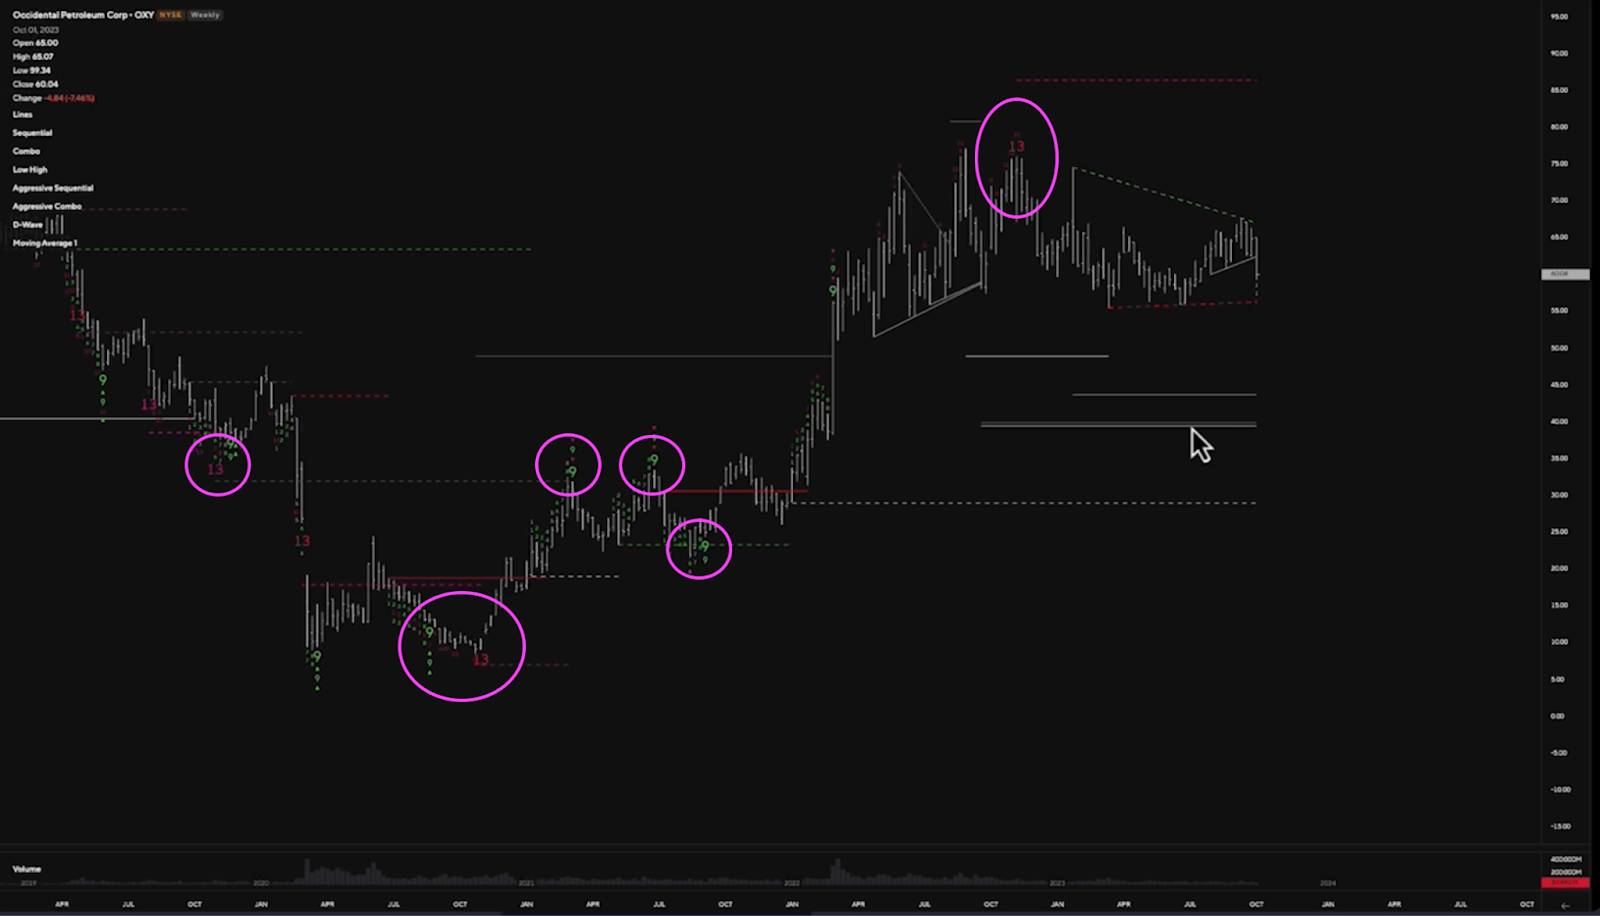
I mentioned we would touch on energy earlier, which is another piece holding up CPI.
Demark indicators have done a great job calling the direction of energy (via OXY, an energy company), calling the exact top back in January, and now showing that it could fall all the way down to 40, a 33% drop.
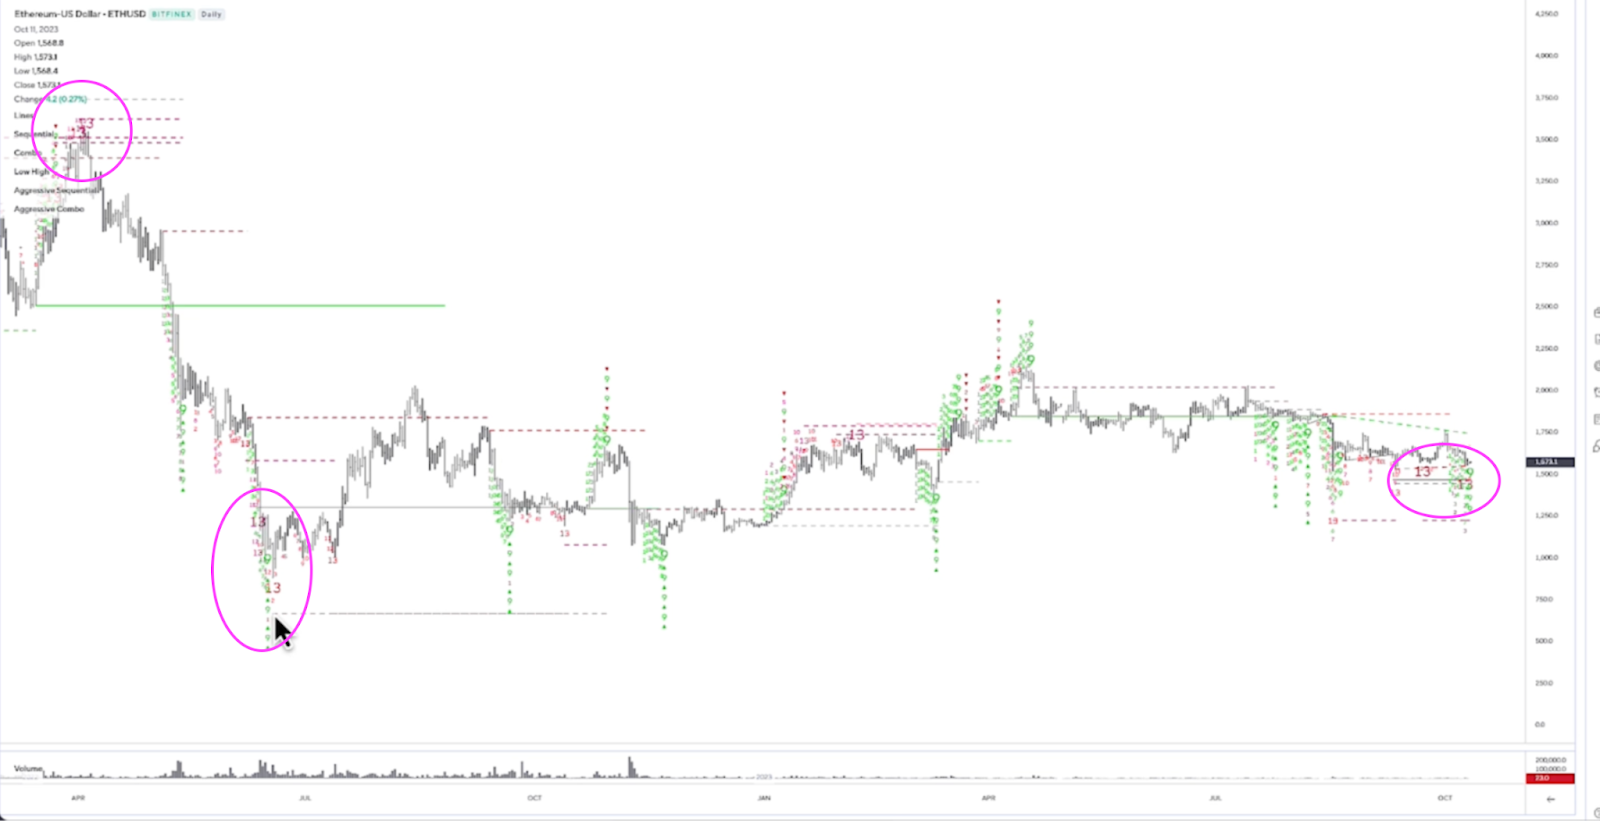
If we move over to crypto, Demark Indicators called the local top and the cycle bottom in July of 2022 for $ETH. It’s currently calling for a clear reversal to the upside.
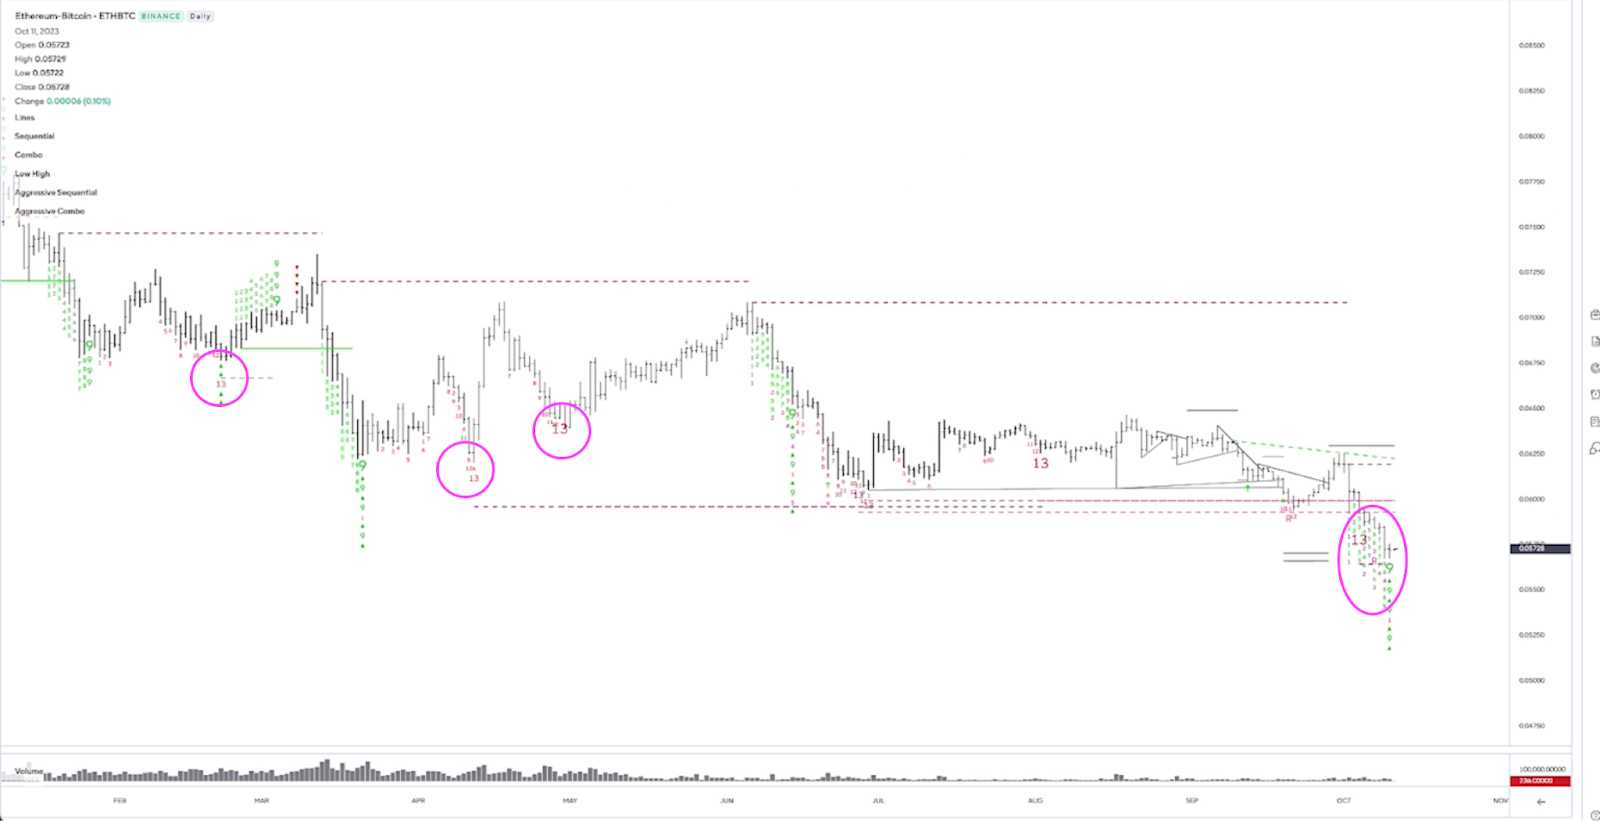
And even if we look at the ETH/BTC chart, which generally suggests ‘risk on’ when ETH is rising vs. BTC, Demark suggests a reversal here too.
To be clear, Demark Indicators are NOT a magic solution. They help guide decisions on market direction and can be useful when combined with other forms of analysis.
What’s interesting about this series of indicators is that it’s a variety of different assets and asset classes, all pointing towards the same thing at the exact same time: a reversal towards a risk on environment – where investors are more willing to take on risk, which is good for crypto.
This rarely happens all at once, especially when we consider the numerous variables in macro suggesting the same thing as Demark indicators.
There’s one last area of analysis I want to pile onto this... Sentiment.
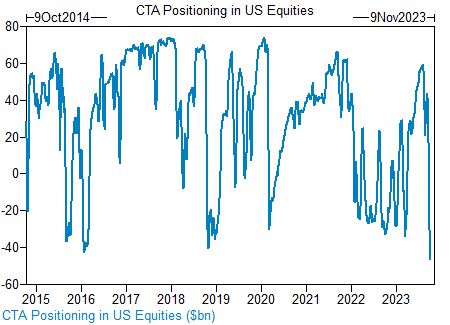
All year, institutions have been underweight risk assets like equities. They missed out on a 38% increase in the NASDAQ, 12.5% increase in the S&P 500 and almost none of them caught the 60% upside in Bitcoin.
When everyone is underweight (or overweight) in a specific trade, that generally means it's due for a reversal, as there’s no one left to keep that trade intact (aka when everyone is underweight there is no one left to sell to make it go lower and vice versa).
It’s also important to note that institutions have set goals in terms of returns that they are supposed to make each year. When they don’t reach them, investors at these companies are fired. The finance industry is cutthroat.
This is why seasonality matters in markets and why Q4 generally does well for risk on. It’s a time when these people swing for the fences to save their jobs or earn their promotions.
At the same time, the market is currently at an all-time high with shorts on US equities (calling that the markets will go lower).
If US equities surprise to the upside, not only will institutions be piling in so they don’t miss out again, but there will also likely be a big short squeeze, pushing prices up faster and higher than most will expect.
Again, I want to reiterate, none of this is a 100% guarantee. Markets could go lower, or they could go absolutely nowhere. What I’m saying is that there are a lot of indicators across various types of analysis that are pointing towards “number go up” rather than “number go down” for risk assets like tech stocks and crypto.
I want to leave you with one final chart…
At the beginning of this report, I showed you a chart with the seasonality of the S&P 500 on average since the 60s. It looks like Q4 of 2023 should be quite nice to us.
Here is that same chart but zoomed out to include 2024, this time showing the average returns of the S&P 500 during election years, which are notoriously good years for markets.
That would put the S&P 500 up 60% from where it currently stands.
YTD, the S&P 500 is up 12%, while the NASDAQ is 3x that and Bitcoin is 5x that.
If we translate those numbers to this chart, that would put the NASDAQ up a hefty 180% by EOY 2024 and Bitcoin up 300%.
Do with that what you will
Here’s my best guess as to what happens next…
I want to reiterate, this is just a guess. This is what I’m expecting and how I’m “playing my cards”, but it doesn’t mean I’m right or that this will happen. Do your own research.
By EOY 2023:
US CPI drops to < 3%
Interest rates remain paused
Bitcoin reaches $35,000 - 40,000
NDX (NASDAQ) blows past all time highs
The one thing I’m unsure of is if $ETH outperforms $BTC during this end-of-the-year rally.
While $ETH has done well this year too, it’s only up 30% vs $BTC’s 62%.
This is very normal for a bear market, so I’m not surprised, however when the “risk on” environment returns, ETH will, without a doubt, outperform Bitcoin.
I’m not sure we are at that point yet, though. Not to mention, with the Bitcoin Spot ETF coming (likely) by Jan 10, 2024, there is some Bitcoin momentum.
I’ve still only been buying ETH as I’m not a short-term trader and I believe that long-term, $ETH wins. But it’s up in the air for me on which asset wins out the rest of the year.
I also don’t believe this is the time to be putting heavy capital into smaller application tokens yet.
Those will have their time, but macro is still leading the way, so I think you're better off in $ETH & $BTC.
When in doubt, always remember how money flows in crypto! Fiat flows into $BTC & $ETH first, before smaller cap altcoins get their turn.

Now, if you’ve made it all the way down here, you’re a real DOer. 💪 And I’m curious about your thoughts!
Do you think that we’ll reach the $40k mark for Bitcoin this year? Reply to this email with a Yes/No! And feel free to share any other thoughts or predictions while you’re at it!
Thanks for reading. And remember, you're strong, you’re powerful, you’re alpha! ❤️
Kyle Reidhead
Founder of Web3 Academy and Impact3
Find him on Twitter
As a PRO, you’re entitled to a PRO or FOUNDERS Pass (NFT), depending on your subscription.
This Pass will grant you access to our token-gated Discord and to other perks such as early access to various protocols and discounts to IRL and online events.
To grab your Pass, simply click the button below, connect your wallet to your Paragraph account and grab your Pass.
Learn the best practices to allocate capital and successfully invest in crypto and web3 with our Web3 Investing Masterclass.
This invaluable resource costs $249. But as a PRO, you get it at a 50% discount.
And as a Founding member, you get it for FREE! 🤯
All you need to do is grab your PRO/Founders Pass (see above ☝) and connect your Pass using the link below. 👇
As a PRO or FOUNDERS Pass holder, you have exclusive access to our token-gated Discord channels dedicated to PRO members!
Upon claiming your Pass, head to Discord and connect your Pass in the #start-here channel (WEB3 ACADEMY PRO category) to unlock access to PRO-only channels!
Disclaimer: This article is for informational purposes only and not financial advice. Conduct your own research and consult a financial advisor before making investment decisions or taking any action based on the content.